
A fast response time can look like good news during an account’s quarterly review. But if your customers keep asking about the same unresolved problem, that number tells only part of the story.
Quarterly business review (QBR) metrics for support teams bring those details together. By looking at all of the team’s metrics as part of a bigger picture, you can see what improved for each account and agree on what still needs work before renewal.
QBR metrics measure support performance in the context of each customer’s goals. They cover how quickly you respond, whether problems stay resolved, and how customers feel about the help they get.
By definition, QBRs are a quarterly business review. Often, they’re structured like meetings with a customer to assess progress and plan the next quarter. Customer support metrics supply evidence for that conversation.
For example, an account may want to expand their contract and use your software in a new department. Repeated timeouts during bulk exports could delay that expansion, even if you answer every request promptly. Reviewing those problems alongside with the account’s plans helps you identify what needs fixing before the customer success team can discuss renewal or an expanded contract.
Look at the support metrics that tell you if your team can deliver the improvements you promise. Account health metrics, like customer experience and operational efficiency, can reveal if the customer is happy with what you’re already offering, or if there’s room for improvement before they expand.
Use these customer experience KPIs as your baseline and choose the measures that explain your account’s main challenges.
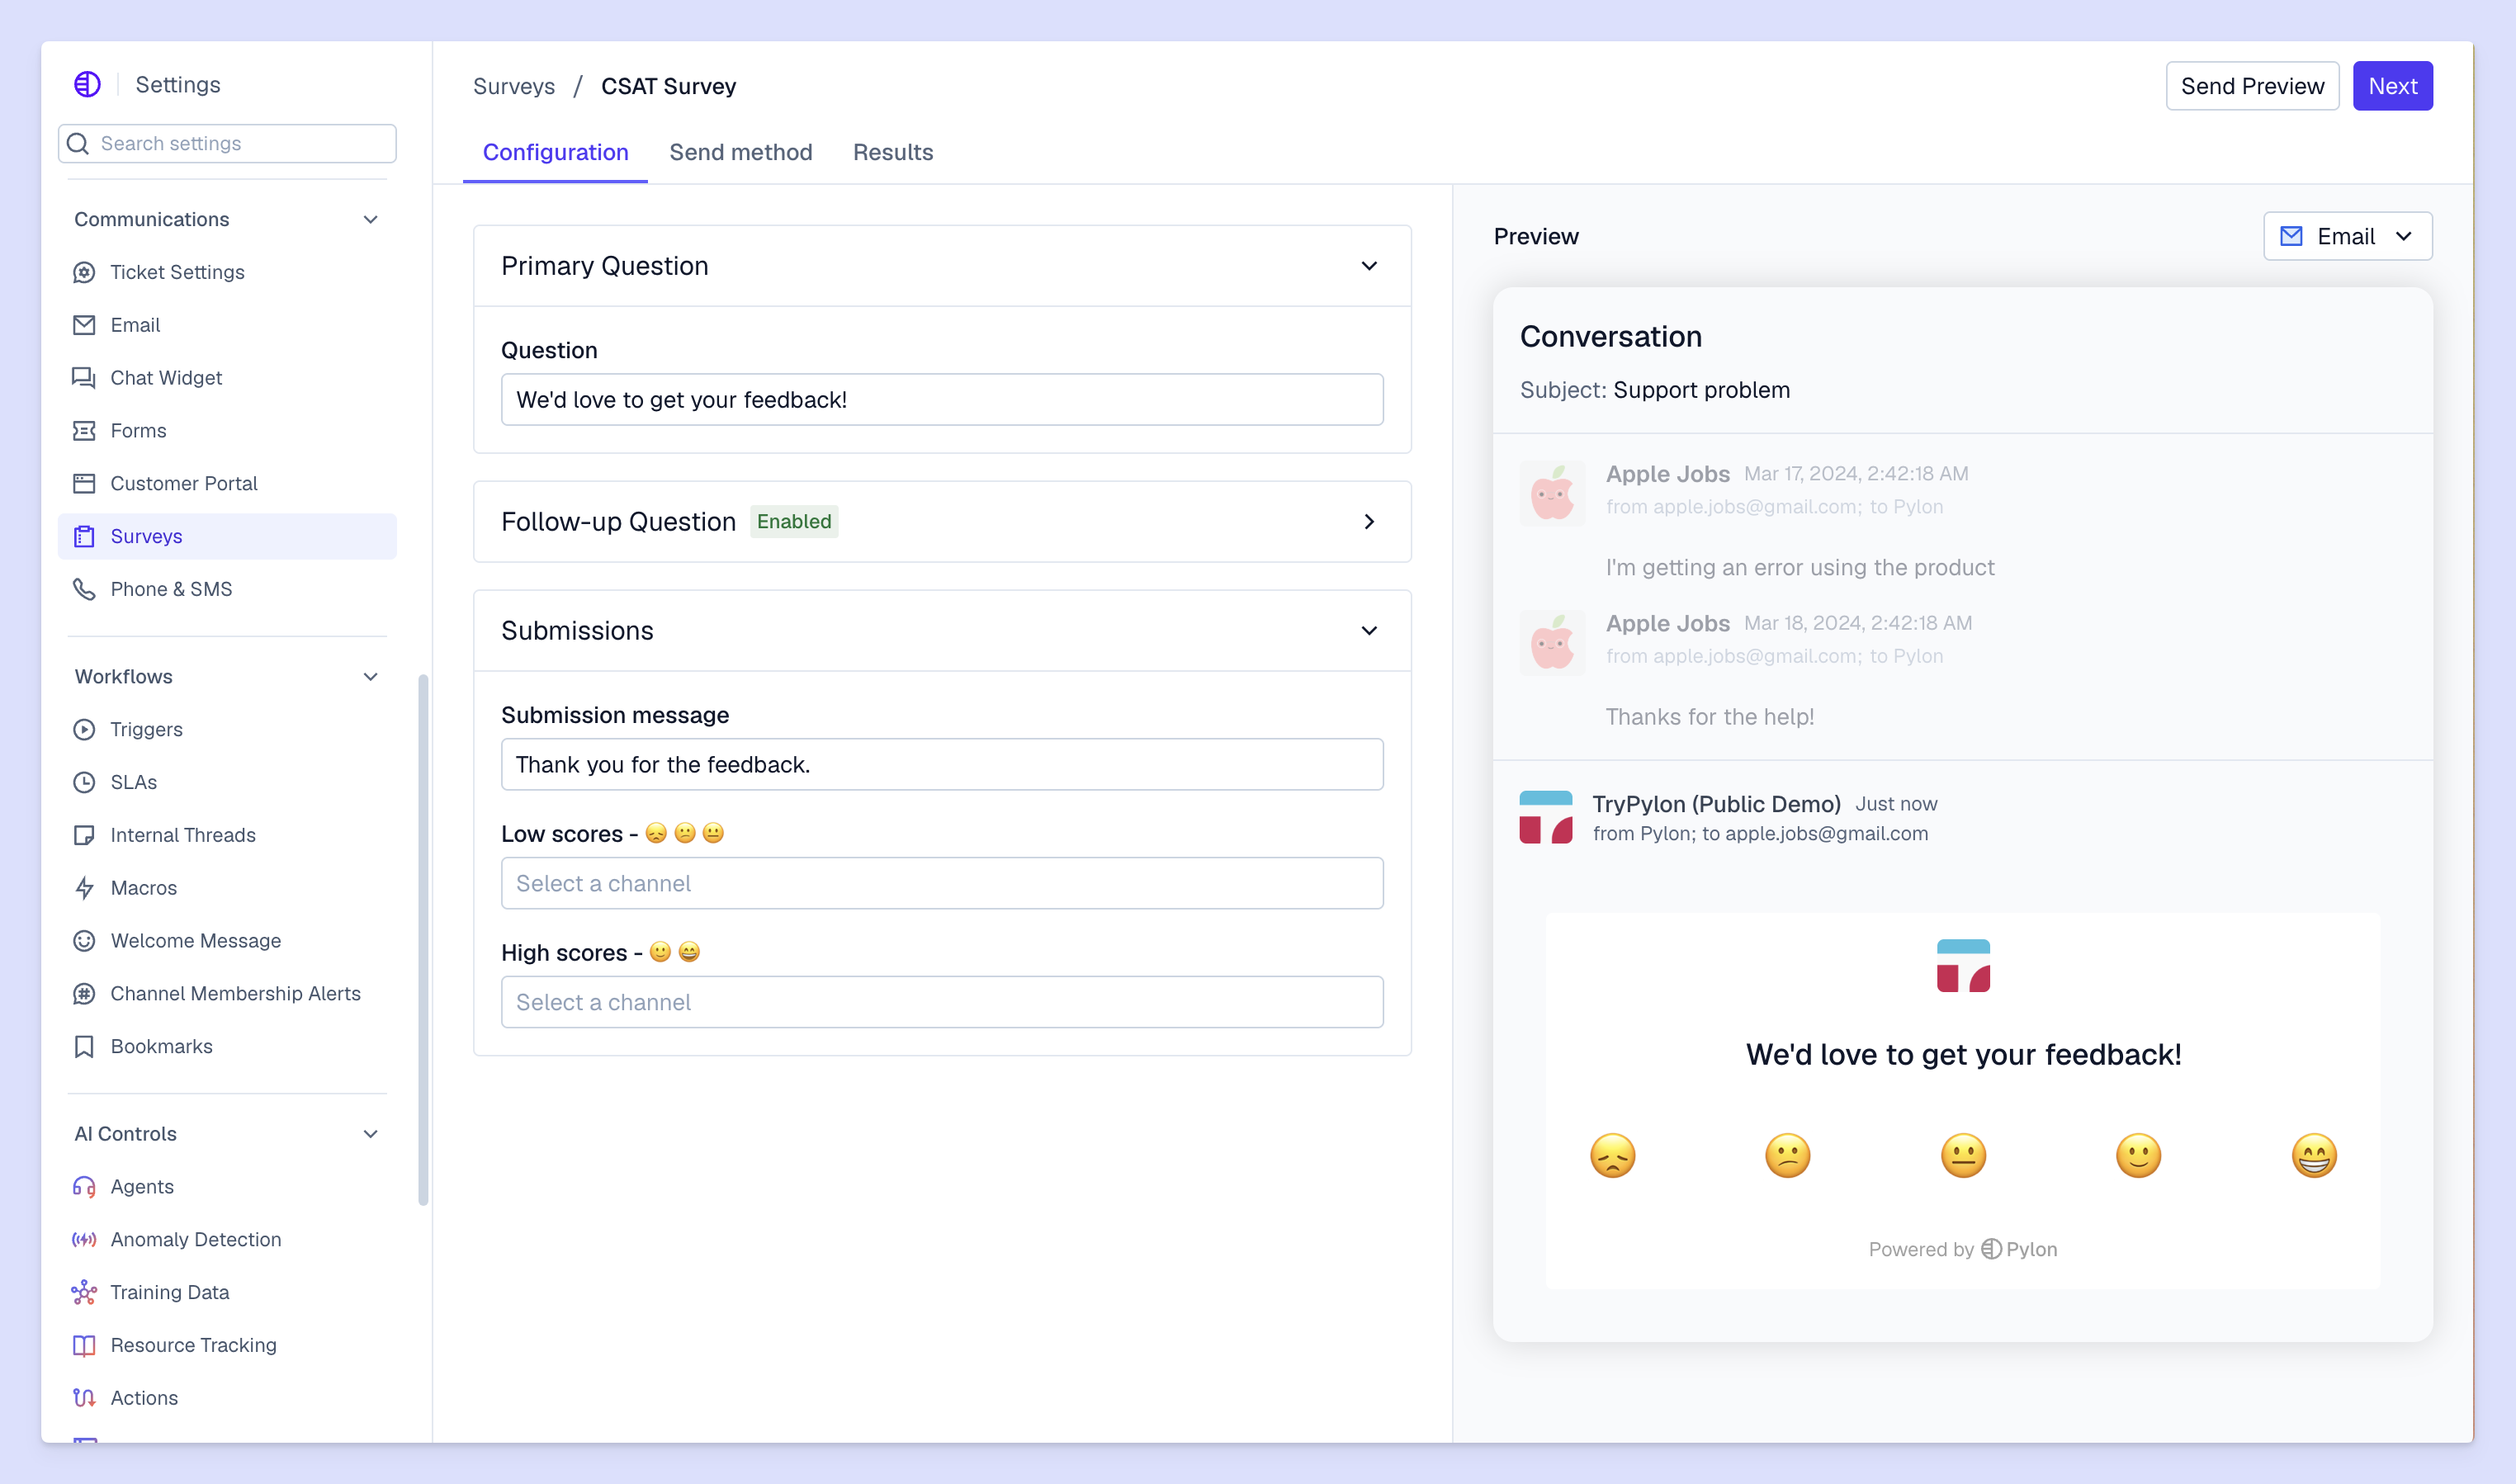
Pylon’s Surveys support NPS and CSAT out of the box. You can build a CES (and other useful measurements) with a Custom survey on an Advanced or Enterprise plan. For quality checks, Pylon’s AI issue QA can review responses against your rubric using credits, and Automations can analyze response quality when tickets close.
Keep customer results separate from headcount. Average handle time (AHT), which measures active work on an issue, helps you assess the team time behind ticket totals. If you don’t factor in whether a team member or AI agent completed the task, you may get an inaccurate picture of future capacity. Pylon’s Workforce Management forecasts account for actual agent resolution, escalation, and intervention rates to estimate the work left for your team.
Consistent definitions and account records make it possible to compare your work every quarter. Start with the following five steps before sitting down with a customer.
Before you get started, write down each calculation and its reporting window, so you can repeat it later. Calculate SLA adherence from applicable targets, excluding issues without an SLA. Here’s what that looks like for a few common metrics:
In Pylon, replies from AI Agents count as a first response for SLA purposes. Keep that distinction visible when agent adoption changes between quarters.
Every conversation from Slack, Teams, and email should be linked to the right account. Check shared consultants or partner contacts carefully, since one person may work with several customers. Otherwise, their requests can distort the account’s results.
Break the account’s issues down by reason for the contact. For the planned department rollout, separate export timeouts from unrelated product questions. Then check whether those export failures recurred, remained open, or repeatedly needed escalations.
That context makes a customer health score easier to understand. A declining score should lead your conversation toward identifying what changed (if anything) and whether the rollout is still blocked.
A quarter-wide average alone won’t show which cases need attention. An account can meet its response SLA while resolution time rises. Pair those measures to expose the difference between getting a reply and getting a fix. If the reopen rate also increases, review whether your team may be closing issues before the customer confirms the solution works.
Review account trends monthly, so you aren’t surprised by an unresolved problem in the QBR. Customer success team members can ask Pylon’s Slack Agent for an account summary in an internal Slack channel, then check on the underlying issues with the support team.
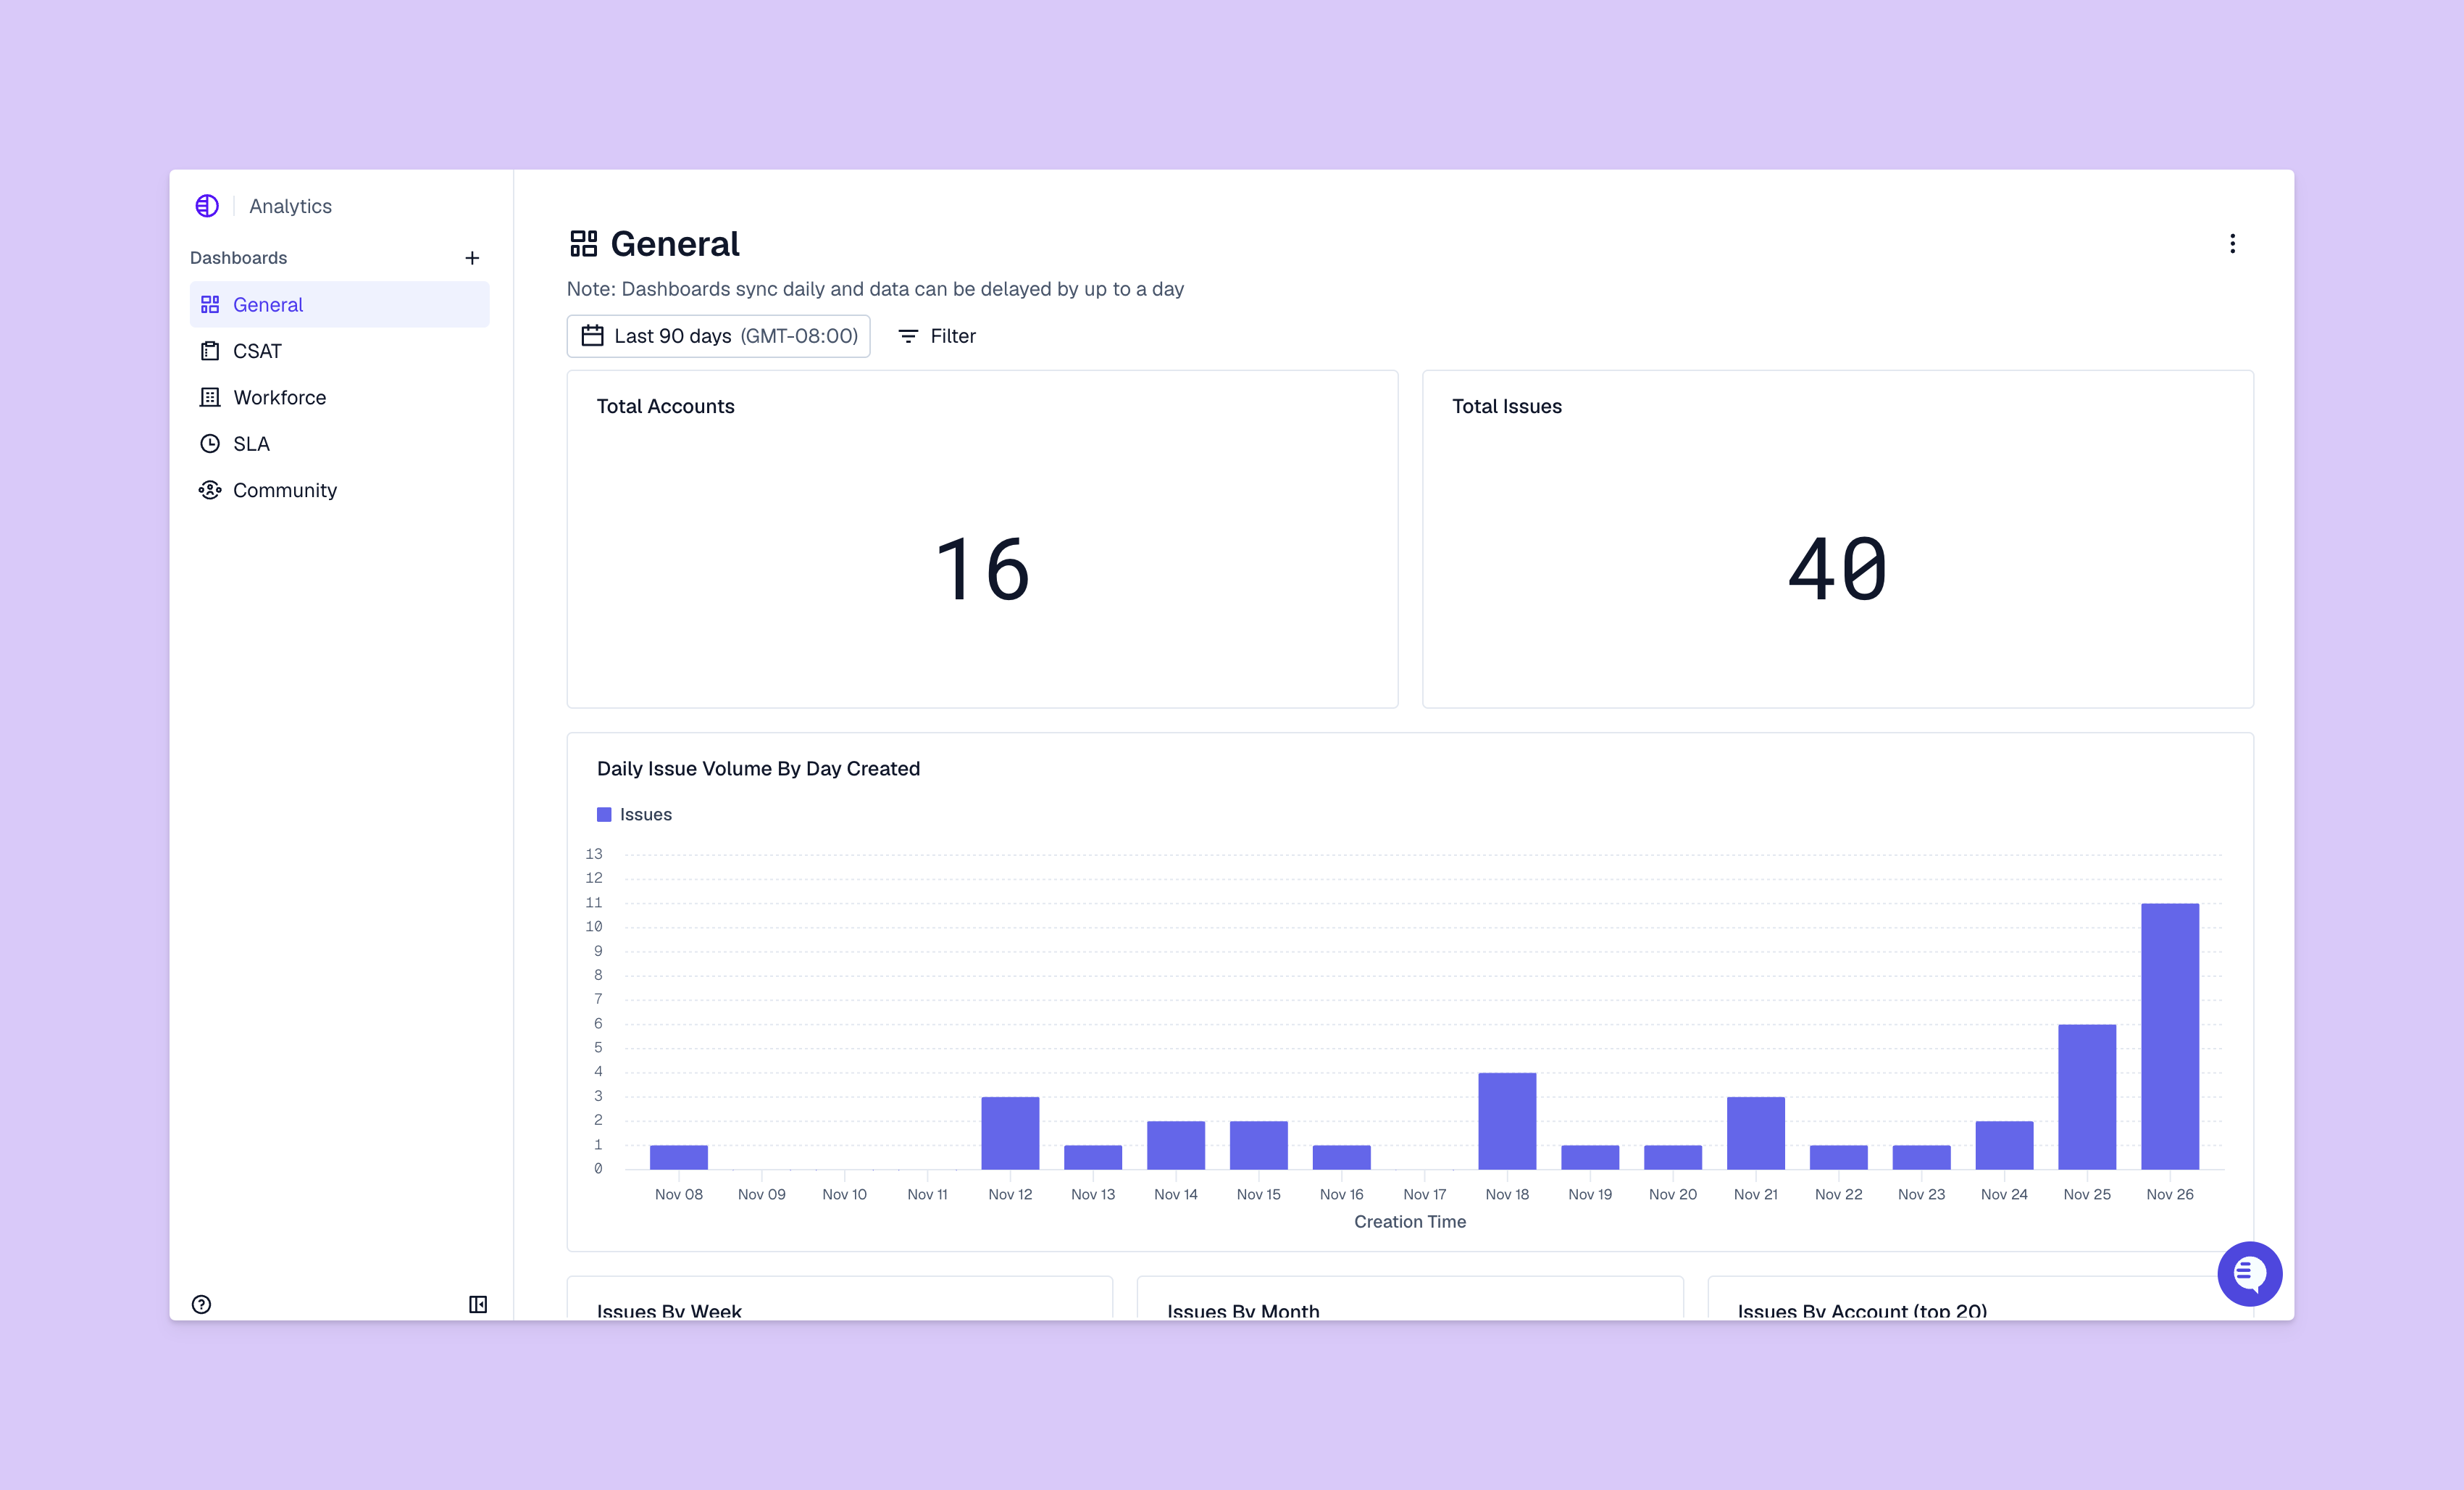
Present leadership with one customer outcome, the measures that explain it, and a specific decision. For example, a customer interested in a new rollout’s outcome is getting the new department working with reliable data exports. You can pair recurring issue volume with resolution time, and use CSAT as a guardrail so faster closure doesn’t come at the expense of the relationship.
Each missing target needs an action, an owner, and a review date. Your dev team might own the export fix, while customer success confirms that the new department can complete its work. Those responsibilities turn support issues into success signals across teams.
Configure Pylon’s Automations to surface the issues relevant to your plan, then have the owner check progress before the next account review. A QBR that customer success teams can act on includes evidence of follow-through, not just a snapshot of the original problem.
Find QBR measures that explain each account’s experience, then attach a next step to any problems they surface. Pylon’s Account Intelligence and Analytics & Reporting tools bring account context and support reporting together across channels, so you can investigate risks and follow up consistently throughout the quarter.
Pylon is the Agentic Support Platform built for B2B support teams. It brings conversations across Slack, Teams, email, chat, and other channels into one place, giving AI the context to help resolve customer issues and continuously improve your knowledge base. Pylon can identify missing or outdated documentation, generate new content from real support conversations, and help your team keep knowledge accurate as your product evolves.
A quarterly business review (QBR) is a meeting with a customer to assess progress toward their goals and agree on next steps four times a year. Support teams contribute evidence about improvements delivered that quarter and problems that are still unresolved.
Review account trends monthly and summarize them quarterly. Update your metric set when customer goals or your support model change, and record definition changes so comparisons stay clear.
Avoid changing denominators and hiding small survey samples to keep your presentation honest. Showing speed without resolution quality can be misleading, too.
Separate account-level results from team capacity, and explain whether AI replies count toward response time.
Start with the customer’s next goal. Then, choose metrics that reveal what may be an obstacle to that goal, and pair performance measures with feedback that shows whether customers found the support useful.
QBR metrics show whether support problems threaten or improve an account’s likelihood of contract renewal or expansion. They’re one part of the equation, but you’ll still need to talk to customer success teams and the customer. A correlation between support activity and retention doesn’t prove that support caused the outcome.
Pylon Workforce Management is available now. See it in action with a live demo.