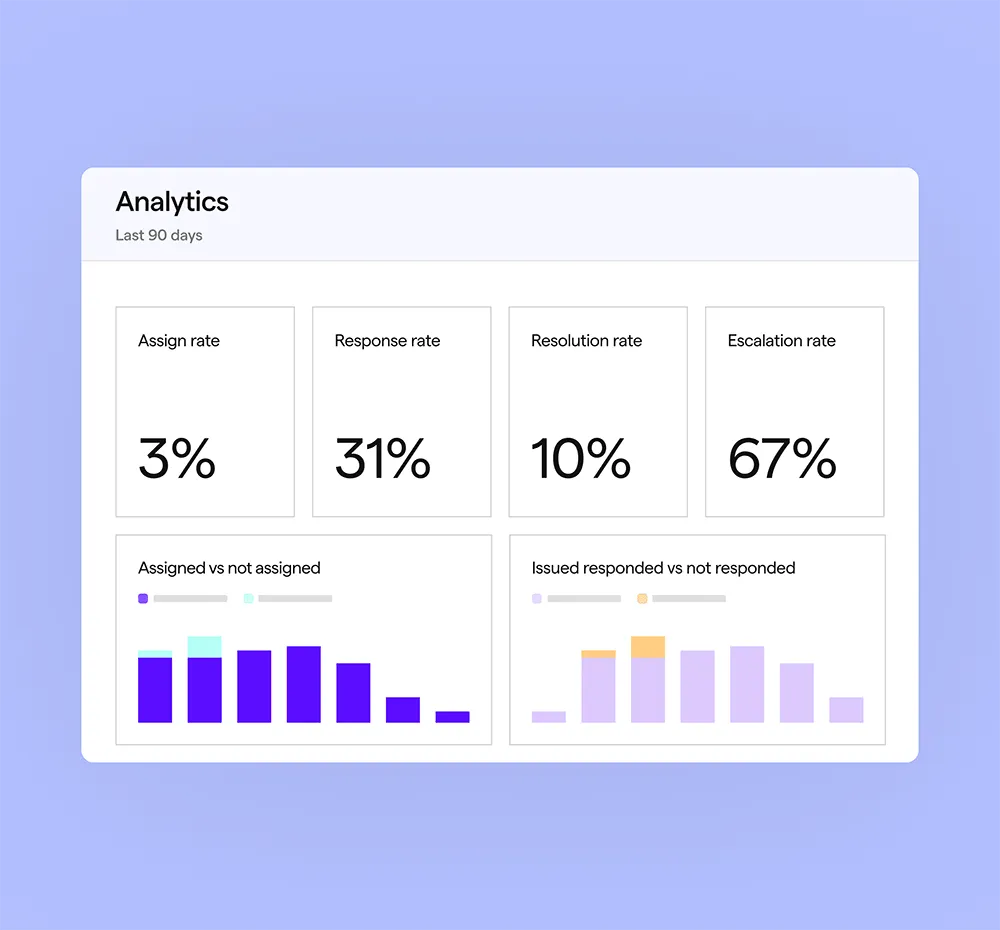












Every Pylon customer gets pre-built dashboards for support, CSAT, AI agent performance, and accounts — automatically, with no setup required. Open analytics and your data is already there, organized the way your team needs it. No blank-slate configuration. No wasting time recreating a dashboard you've built before.

Pre-built dashboards are a starting point, not a ceiling. Clone any dashboard and AI can customize it — add metrics, change chart types, apply filters, build formulas. Teams with specific reporting requirements can build exactly what they need without touching the defaults. Organize and share dashboards exactly how you want.
The core metrics your support leadership needs to run the team and SLA adherance: ticket volume trends, resolution rates, response time, and backlog health. Track what's growing, what's stalling, and where your team needs attention.
Measure your AI where it actually matters: how often it resolves without human involvement, how that compares to human performance, and whether adding AI made your team faster.
For CS and account management teams: understand what's happening across your book of business, not just inside your support queue. Connect support patterns to account health before problems escalate.



Pylon includes reporting for support operations, human performance, agent performance, customer health, and account outcomes. You can track metrics across issues, channels, customers, agents, Skills, and workflows.
Track how often each agent resolves, escalates, or requires human intervention. You can also inspect accuracy, execution quality, the Skills used, and where the agent’s instructions or knowledge need improvement.
Yes. Ask for a dashboard, metric, filter, or breakdown in natural language. You can organize and share the result without rebuilding a report from scratch.
Pylon’s reporting starts from the support, account, and product intelligence already built across the platform. Prebuilt views work immediately, and you can extend them with your own fields and definitions.
Yes. Account analytics connect issues, sentiment, usage, engagement, and support history to churn risk, expansion signals, and renewals.
Analytics identifies where agents resolve successfully, where they escalate, and where they fail. Those findings can surface suggested improvements to agents, Skills, workflows, and knowledge for your team to review.