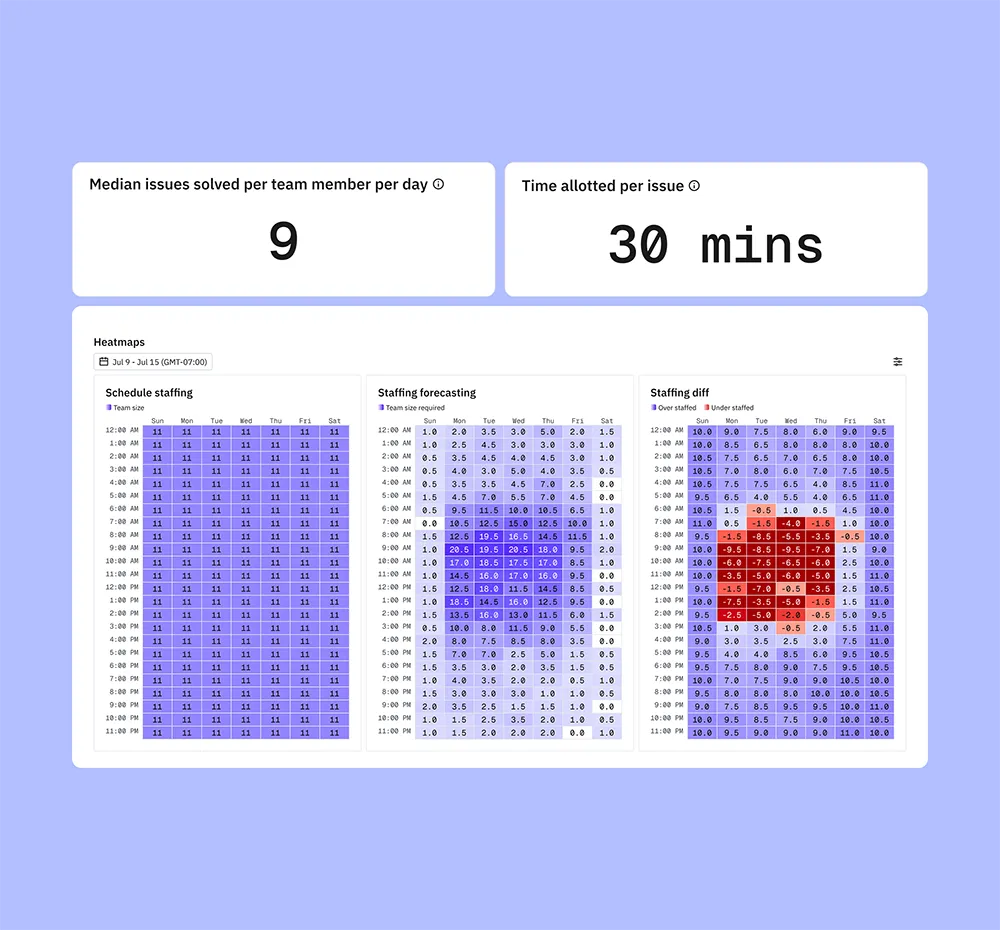












Teams currently pull Pylon data into Excel, build formulas for averages and capacity calculations, and refresh manually. Staffing Heatmaps do all of that automatically — calculated from your live issue data, always current, never requiring an export.
Heatmaps are scoped by team. Your general support team might be well-covered while technical support is drowning on Tuesday afternoons. Pylon shows both — separately — so you can staff each team based on its own patterns, not a blended average.
When you need to justify a new hire, "it feels like we're stretched thin" doesn't hold up. A staffing difference chart that shows a consistent 40% gap between scheduled and needed coverage on Monday mornings does. Pylon gives you the number.



Pylon Workforce Management forecasts support demand and the capacity required to meet it. It accounts for work handled by both agents and people, then shows where coverage is sufficient or needs to change.
The model uses actual agent resolution, escalation, and intervention rates. As agents take on more or less work, the forecast updates the remaining workload for your human team.
Forecasts use live issue volume, arrival patterns, channels, resolution rates, escalation rates, handle time, schedules, and team capacity from inside Pylon.
You can inspect demand and coverage by day, hour, channel, team, time zone, and skill set. This makes short coverage gaps visible instead of hiding them inside averages.
Yes. Change expected volume, agent resolution, handle time, schedules, or headcount to see how each scenario affects future capacity.
No. Workforce Management uses live operational data already in Pylon. Forecasts update as support volume, team performance, and agent performance change.