
Your last support report shows whether your team met its service commitments, but a healthy monthly average could hide a growing queue of complex issues. Predictive data analytics connects account and operational signals to help you plan for that work before it becomes a backlog, and identify and predict churn signals long before renewal conversations start.
In this article, you’ll learn which predictive analytics are valuable for support teams, and how each forecast sets up a decision your team can actually make.
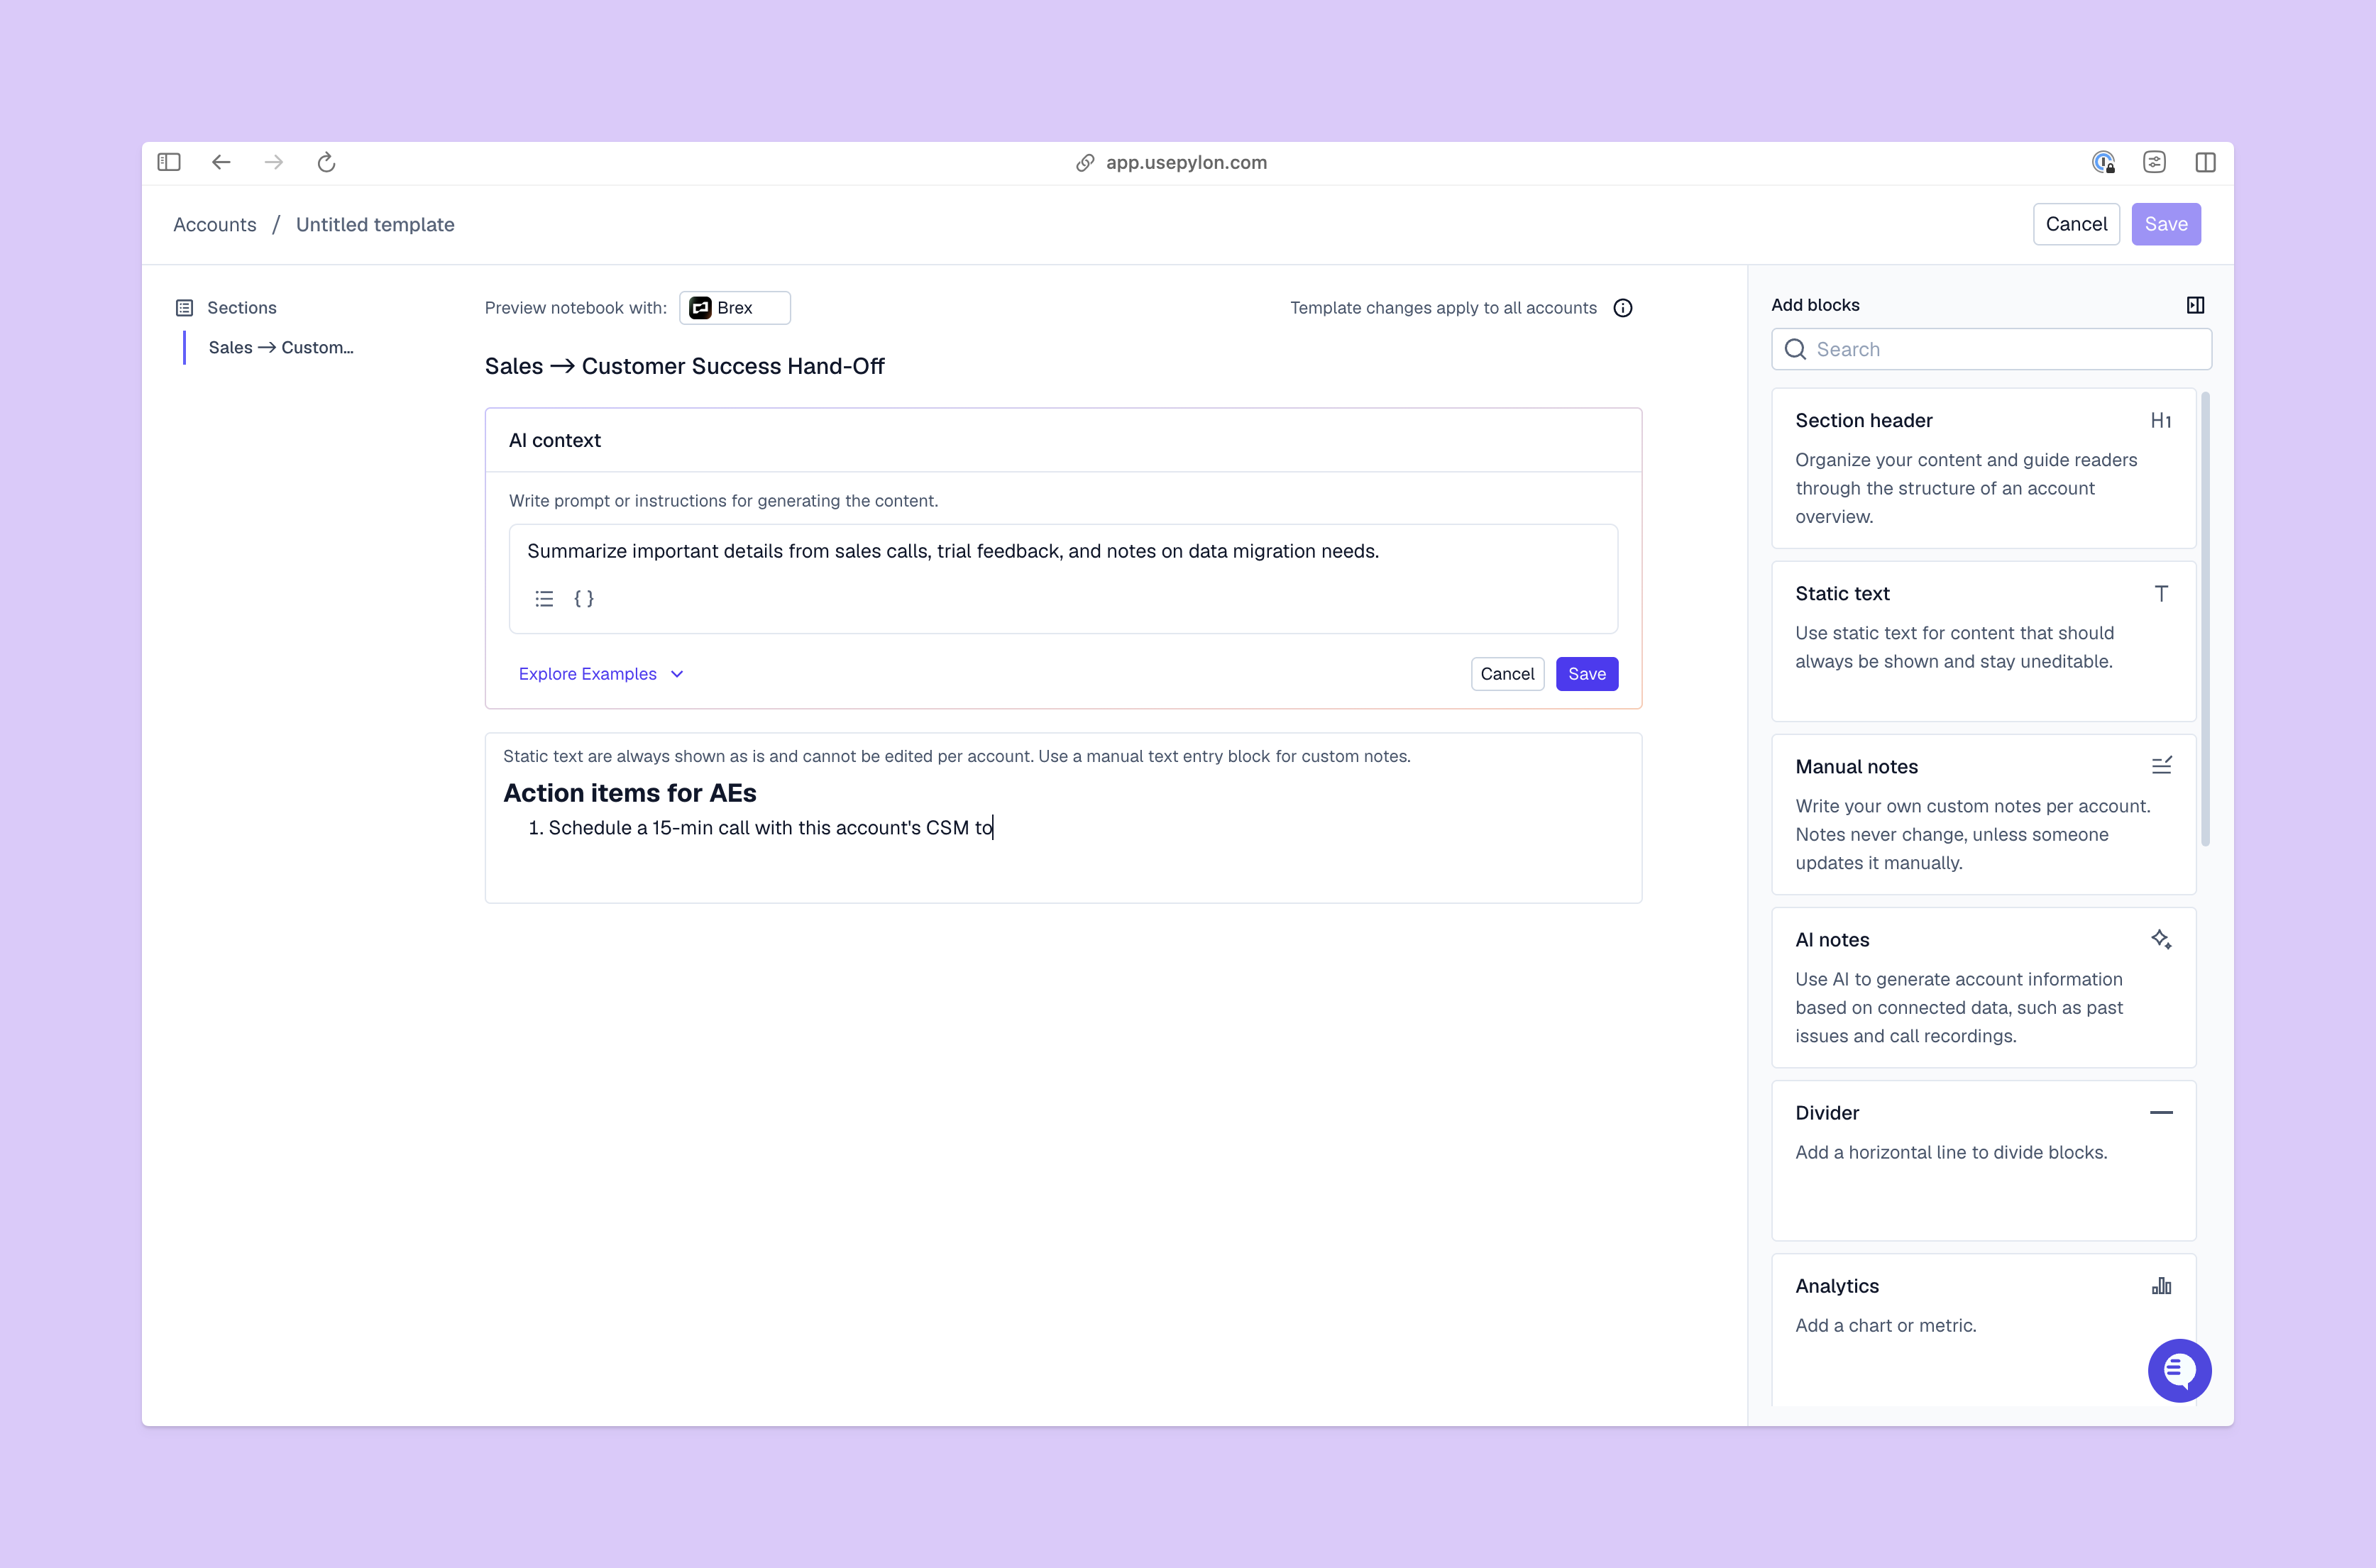
Predictive data analytics uses live and historical data and machine learning models to estimate future outcomes. For support teams, those outcomes might include next week’s ticket volume, likely delays, or the chance that an issue will escalate.
That data can help you understand and build a stronger customer support dashboard. Instead of waiting for a backlog to appear in your monthly report, you can assess whether incoming work is likely to exceed your team’s capacity and adjust coverage as needed.
There are two main ways that predictive data models show up for support teams: on-team support and account context. For staffing, you’ll need to reference support KPIs, such as ticket arrival patterns and resolution times.
To assess account risk, you might pull product usage data, contract and renewal dates, and account health scores. Customer satisfaction score (CSAT) and net promoter score (NPS) trends are also useful to understand how client sentiment changes and what may drive those changes.
A predictive health score summarizes current conditions and offers potential future conditions, but isn’t a guarantee. Before you use one to guide a renewal intervention or other serious conversation, ask yourself what it actually measures and bases its suggestion on. That distinction can keep your team from treating correlation as causation.
Predictive analytics and modeling connect the relevant inputs to an estimate that your team can use. You don’t need to generate the algorithm yourself, but you should understand the three-step process that turns data into a forecast and what happens when it’s wrong.
Start by connecting support conversations and context to the right accounts. Then, add customer relationship management (CRM) records, product events, and renewal dates that give other kinds of useful information to the model.
Everyone on the support team, and every channel where customers communicate with them, needs to use consistent definitions for this step to work. If one channel counts reopened issues as new tickets and another doesn’t, the combined volume can misrepresent demand.
You’ll also need data validation checks to catch missing or unexpected inputs. A broken product usage feed, for example, shouldn’t translate as evidence that customers have stopped using your product.
Once the model has usable data, it looks for correlations between earlier conditions and later outcomes. Recurring demand patterns (like more queries that need to be escalated two weeks after an update rollout) can inform a volume forecast, while the relationship between number of unresolved tickets and engagement rate could create a rough estimate of churn risk.
Ask your vendor or analytics team to test those predictions against later outcomes to judge their accuracy. The test should use information available when the prediction was made. For instance, including details about a customer’s later cancellation in a retroactive risk assessment would make the model look useful without actually helping you intervene.
The final output might be an expected ticket count, a resolution time range, or a risk score. You need to decide who acts on that data and when. For example, a range of possible ticket volumes can help you estimate team coverage needs during scheduling. A support lead might set aside time every week to review new and existing tickets from an account that’s been predictively flagged as “at risk.”
Before building new workflows around a forecast, test a few scenarios using data excluded from training. As your products and processes change, keep comparing predictions with actual outcomes. This gives you a basis for deciding which forecasts should influence your work and which still need testing.
Set the threshold for an alert with a specific action in mind, because catching more potential problems can also create more false alarms.
When you connect forecasts to clear team responsibilities, you can make proactive, data-driven decisions in the following ways:
These advantages rely on the action that follows the forecast; an accurate warning won’t improve service if nobody owns the response. That makes clear task ownership one of the most important parts of effective customer support.
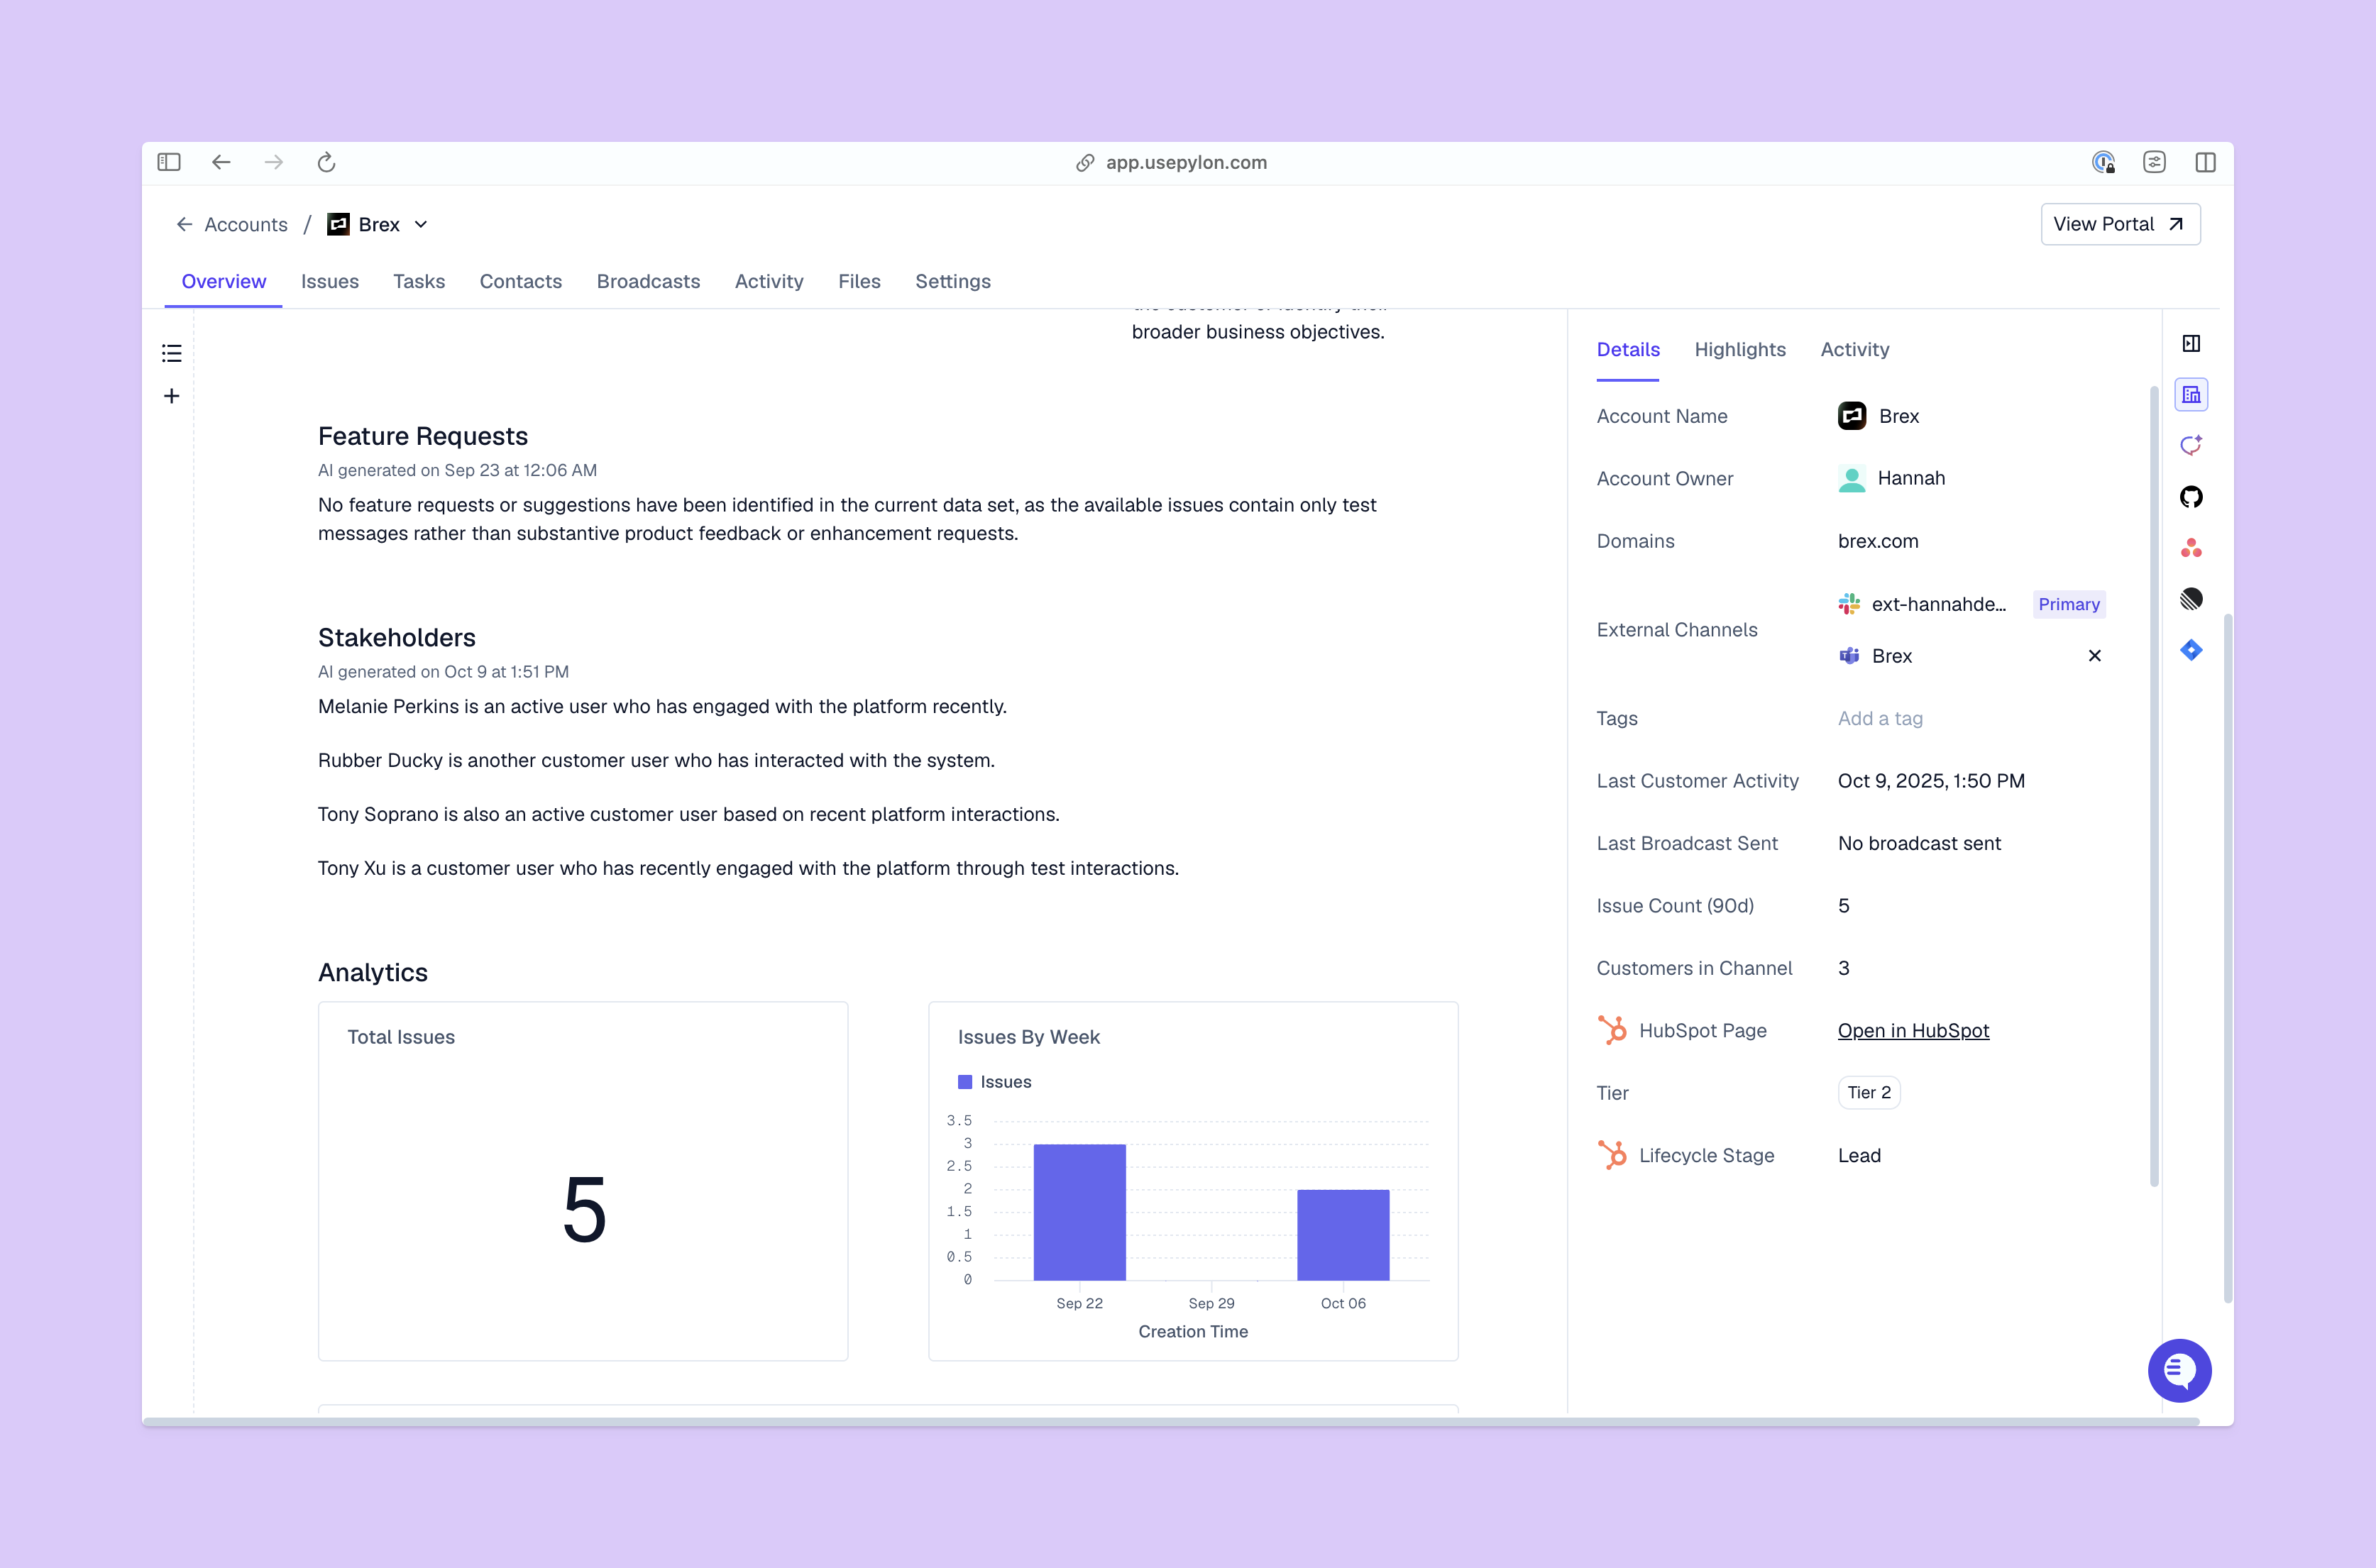
The following predictive analytics examples show how you could balance quality service and costs without treating every rising risk score as an emergency.
Compare expected ticket volumes with the work your team can complete during the same period. Include how much time they’ll need to tackle smaller tasks, like handoffs, admin, and the existing backlog, then check coverage by skill and time zone. A daily total won’t tell you whether the right specialist is available during a demand peak.
As you scale your support model, account for work handled by AI agents, too. Pylon’s Workforce Management forecasts include your team’s agentic support using operational data like agent resolution and escalation rates. This can help you estimate your team’s actual workload more reliably.
Relevant inputs for a model designed to predict service-level agreement (SLA) breaches might include remaining response time, queue depth, and issue complexity, alongside team coverage. A high-risk flag, for instance, could prompt a manager to reassign an issue to an available specialist while there’s still time to respond.
Validate that capability separately from a standard SLA countdown. A timer shows how much time remains, while a prediction estimates whether your current conditions suggest you’ll make it.
Account context helps you decide how to respond when several issues compete for attention. Repeated unresolved problems close to renewal might need a collaborative review between customer support and success teams, especially when those problems affect the customer’s work.
Use that review to agree on an owner and recovery plan. Revenue can shape the decision, but it shouldn’t override immediate impact or contractual commitments for other accounts.
A resolution forecast could compare an open issue with how long it took to solve similar cases in the past. You can use the estimate to plan specialist capacity and set expectations about the next update, including dependencies and handoffs.
Keep the estimate separate from a promised fix date. If resolution depends on an update from engineering, your support team should confirm that dependency before sharing a timeline with the customer.
Predictive data analytics can be part of your broader B2B customer service best practices. First, your team (including AI agents) needs connected account data, clear forecast definitions, and a path from a signal to an assigned action to turn support signals into revenue-impacting outcomes. The same information builds strong AI models, so accurate, up-to-date data sets a higher standard for every part of a proactive operation.
Pylon is the Agentic Support Platform built for B2B support teams. It brings conversations across Slack, Teams, email, chat, and other channels into one place, giving AI the context to help resolve customer issues and continuously improve your knowledge base. Pylon can identify missing or outdated documentation, generate new content from real support conversations, and help your team keep knowledge accurate as your product evolves.
Descriptive reporting looks backward at ticket volume, CSAT, and resolution times. Predictive analytics looks forward to estimate future backlogs, escalations, and staffing gaps, so your team can take advantage of the opportunity to act.
Ticket patterns, engagement changes, and product usage can inform churn risk assessments. Their reliability depends on your customers and data, so test combinations against actual renewal outcomes rather than assuming one signal predicts churn accurately everywhere.
You may be able to use built-in forecasting without an entire team backing it up. Custom models take a lot of time and effort for data scientists to build, and either approach needs trustworthy inputs and ongoing evaluation. Before you commit, verify that a platform’s health scoring actually supports the predictions you need.
Predictive analytics in business can connect account risk with upcoming renewals, helping you prioritize investigation and outreach to keep revenue coming from an account. Tracking what happens after those interventions helps you assess whether your retention workflows address customer problems and contribute to stronger renewal outcomes.
Pylon Workforce Management is available now. See it in action with a live demo.