You can get positive support ratings from customers who still struggle to use your product. A support reply may show someone how to work around a confusing workflow without fixing the workflow itself. If you only review the rating, you could miss the product issues harming satisfaction and contributing to customer churn.
Customer experience metrics for SaaS help you connect support interactions with what customers do next. That connection lets you spot where they need help, decide what your team should change, and check whether the change makes the product easier to use.
What are customer experience metrics?
Customer experience metrics indicate how customers perceive your company and what happens as they use your product. Metrics can cover individual moments, like getting help with setup, as well as longer-term outcomes, like continuing a contract.
These measures complement product usage and revenue data. Support ratings tell you how customers feel after an interaction, while usage data shows whether the customer completed the task afterward. Together, they give you a clearer picture of the SaaS customer experience than either source alone.
For example, a new customer may appreciate your explanation of workspace permissions but still not invite their colleagues. Reviewing satisfaction alongside invitation completion reveals a gap between good support and successful setup. You can then investigate that gap before completing onboarding.
Customer experience metrics SaaS teams should track
Group your customer experience metrics by what they help you determine, from where friction may happen to how support handles it and whether customers stay.
Leading signals
Leading signals can reveal trouble before renewal, giving you time to respond. Begin with feedback from recent interactions and evidence of customers reaching an important product milestone.
Customer satisfaction score (CSAT) measures satisfaction with a specific experience. For CSAT questions on a five-point scale, divide the number of four- and five-point ratings by the total number of responses, then multiply by 100. Take note of the number of responses alongside each customer satisfaction score. A high score based on only a few replies may not reflect the experience of all customers.
Customer effort score (CES) tracks how easy or difficult a task was. Your customer effort survey might follow workspace setup, helping you distinguish a friendly support exchange from an easy process. Specify the scale and which direction means less effort before comparing scores.
Onboarding completion tracks the share of eligible new accounts that reach your chosen milestone within a defined period. For a collaboration product, that milestone could be a team completing its first shared project. Creating an account alone wouldn’t demonstrate that value.
A high CSAT with low completion suggests customers like the help but still need a better path through setup. Survey comments and unfinished steps can tell you where to investigate.
Operational signals
Your operational support signals include customer support metrics and help highlight the problems that repeatedly consume your team’s time.
First-contact resolution is the share of eligible issues solved in the first interaction without further contact. Set a consistent definition of “first interaction” across channels, as your team may count a long Slack thread and a short email exchange differently.
A backlog is the open work your team still needs to resolve. Review age as well as volume, because a steady total can hide older issues that never move forward. Grouping the backlog by topic helps you tell whether one product problem is responsible for much of the wait.
Escalation rate is the share of eligible issues handed to another team or specialist. A rise in escalations could mean support needs better guidance, but it can also reflect more complex customer use cases.
Service desk KPIs can help explain workload. For example, repeated permissions questions may keep moving from support to customer success because neither team has assigned ownership of the setup instructions.
Outcome signals
Outcome signals show what happens to customer relationships over time. They help you assess the broader impact of the experience, but they don’t identify its cause on their own.
Net promoter score (NPS) measures a customer’s willingness to recommend your company. To calculate NPS, subtract the percentage of detractors (those who respond with a 0–6 rating on an 11-point scale) from the percentage of promoters who score 9–10. NPS reflects the overall relationship, including the product and commercial experience.
Customer retention rate shows how much of your starting group remains at the end of a defined period, while customer churn rate shows the share that leaves. Use the same starting group and period for both rates without including newly acquired customers.
Your customer retention trend becomes more useful when you connect it with earlier experience signals. Compare customers who completed onboarding with those who didn’t while allowing for differences in account size and product fit, which can reveal issues without assuming onboarding explains every cancellation.
How to choose the right metrics
Choose metrics for customer experience around the decisions you need to make next. If your team needs to support more accounts without adding the same amount of work, pair a workload measure with a customer outcome metric. Tracking resolution efficiency alongside satisfaction helps you check whether a cost-saving change actually leaves customers better served.
Consider your company’s growth stage:
- Early stage. Prioritize onboarding completion and the support questions that prevent customers from reaching first value. You need to learn where the product needs clearer guidance.
- Growth stage. Add backlog age and escalation rate to see whether increasing demand overwhelms your process. Keep satisfaction in view so you don’t confuse faster handling with better help.
- Mature stage. Give retention and churn more weight, then trace changes back to specific experiences. Keep the operational measures that let your team act before a renewal is at risk.
Match the measure to the customer’s journey. Effort helps assess setup, resolution measures explain support encounters, and recommendation or retention signals inform account reviews. The right support KPIs will differ for a self-serve product and a complex implementation with a dedicated support team.
Give each selected metric an owner, review schedule, and threshold for investigation. Set thresholds from your own baseline and service commitments, using relevant benchmarks for context. Keep daily work in your support view and customer outcomes in your board report.
How to collect and act on customer experience data
Begin by connecting each source to a shared account identifier. Surveys explain how customers feel, tickets show what they asked for, and product events show what they completed. Channel activity adds context about where exchanges happen, but message volume alone doesn’t prove satisfaction or dissatisfaction.
Bring those sources into a reporting layer that lets you separate new and established accounts. Then group similar accounts by type and support arrangements, keeping guided implementations separate from accounts that handle setup independently.
Pylon’s Analytics filters let you narrow reports using issue, account, and contact properties. Pylon’s Account Intelligence setup (a paid add-on) also supports bringing in usage data through a CRM or reverse ETL sync. That data still needs to be connected and defined before you can use it to explain product behavior.
When a metric shifts, read customer comments and conversations before choosing a fix. If setup effort rises around workspace permissions, check whether customers struggle with the instructions or the product itself. Support can clarify an unclear answer, while a confusing permission screen may need work from your dev team.
After the change, compare the same setup milestone for subsequent groups of new accounts. Check whether completion improves and whether related support requests fall. Those results can help you assess customer progress and support workload to inform your customer retention strategy. Keep measuring the customer experience to check whether improvements last.
Bring your customer experience metrics into one view with Pylon
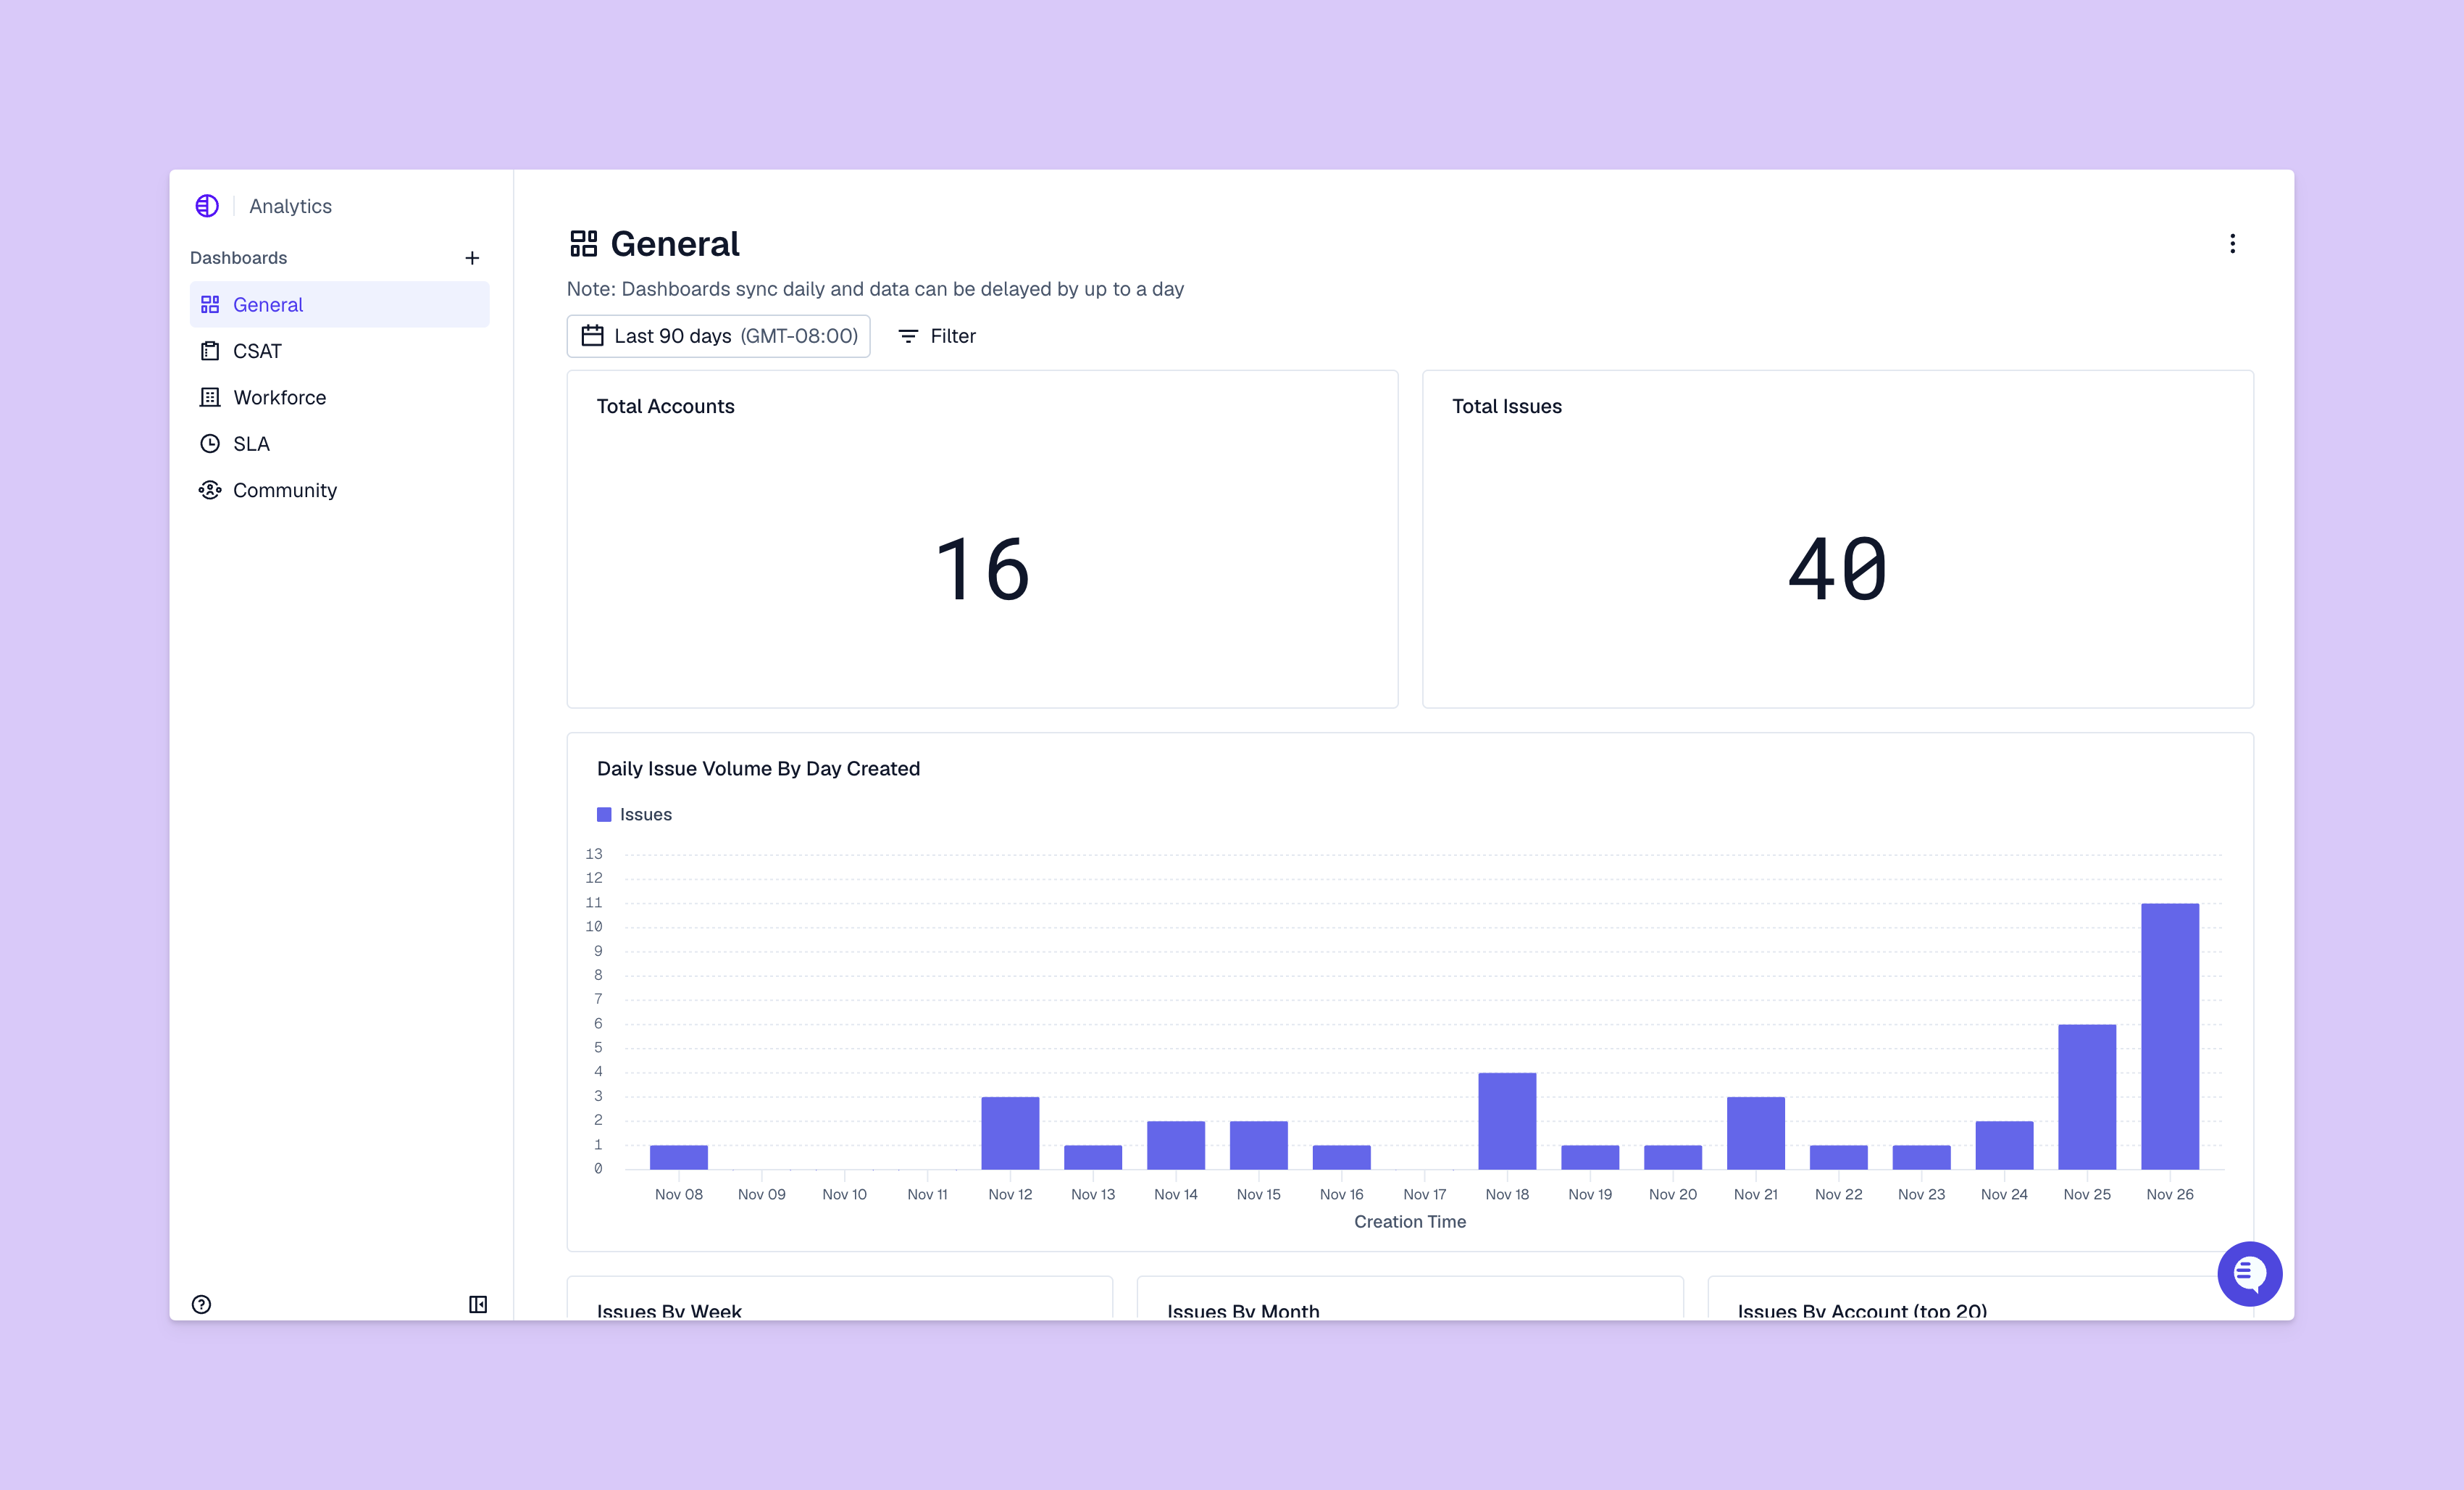
A useful reporting view connects a customer’s feedback with the issue behind it and the person responsible for follow-up. Pylon’s Analytics & Reporting and Pylon’s Surveys bring support results and survey feedback together with account context. Use that view to choose a specific improvement, then check its effect on the same customer group.
Pylon is the Agentic Support Platform purpose-built for B2B, trusted by 1,800+ B2B customers. Default dashboards, CSAT and NPS surveys, and filters by issue, account, and contact properties live in the same platform your team uses to resolve issues, so a metric change leads straight to the conversations behind it.
FAQ
What is a good net promoter score for a SaaS company?
There isn’t one universal target. Compare results with your own history and similar customers surveyed the same way. A positive score means promoters outnumber detractors, but the reasons behind the ratings tell you what improvements to prioritize.
What does CSAT measure?
CSAT measures satisfaction with a particular interaction or experience. Use a consistent survey question and send it at the same point in the process so changes in timing don’t distort response trends.
What does net revenue retention include?
Net revenue retention includes initial recurring revenue plus expansion, minus downgrades and churn, divided by initial recurring revenue. Multiply by 100 for a percentage. Net revenue retention excludes new customers and can exceed 100% when expansion outweighs losses.
Why should SaaS teams avoid tracking metrics in isolation?
One measure can improve while the customer’s overall experience gets worse. Pair feedback with task completion and support outcomes so you can see whether a change helps customers achieve what they came to do.
How does Pylon track CSAT and NPS?
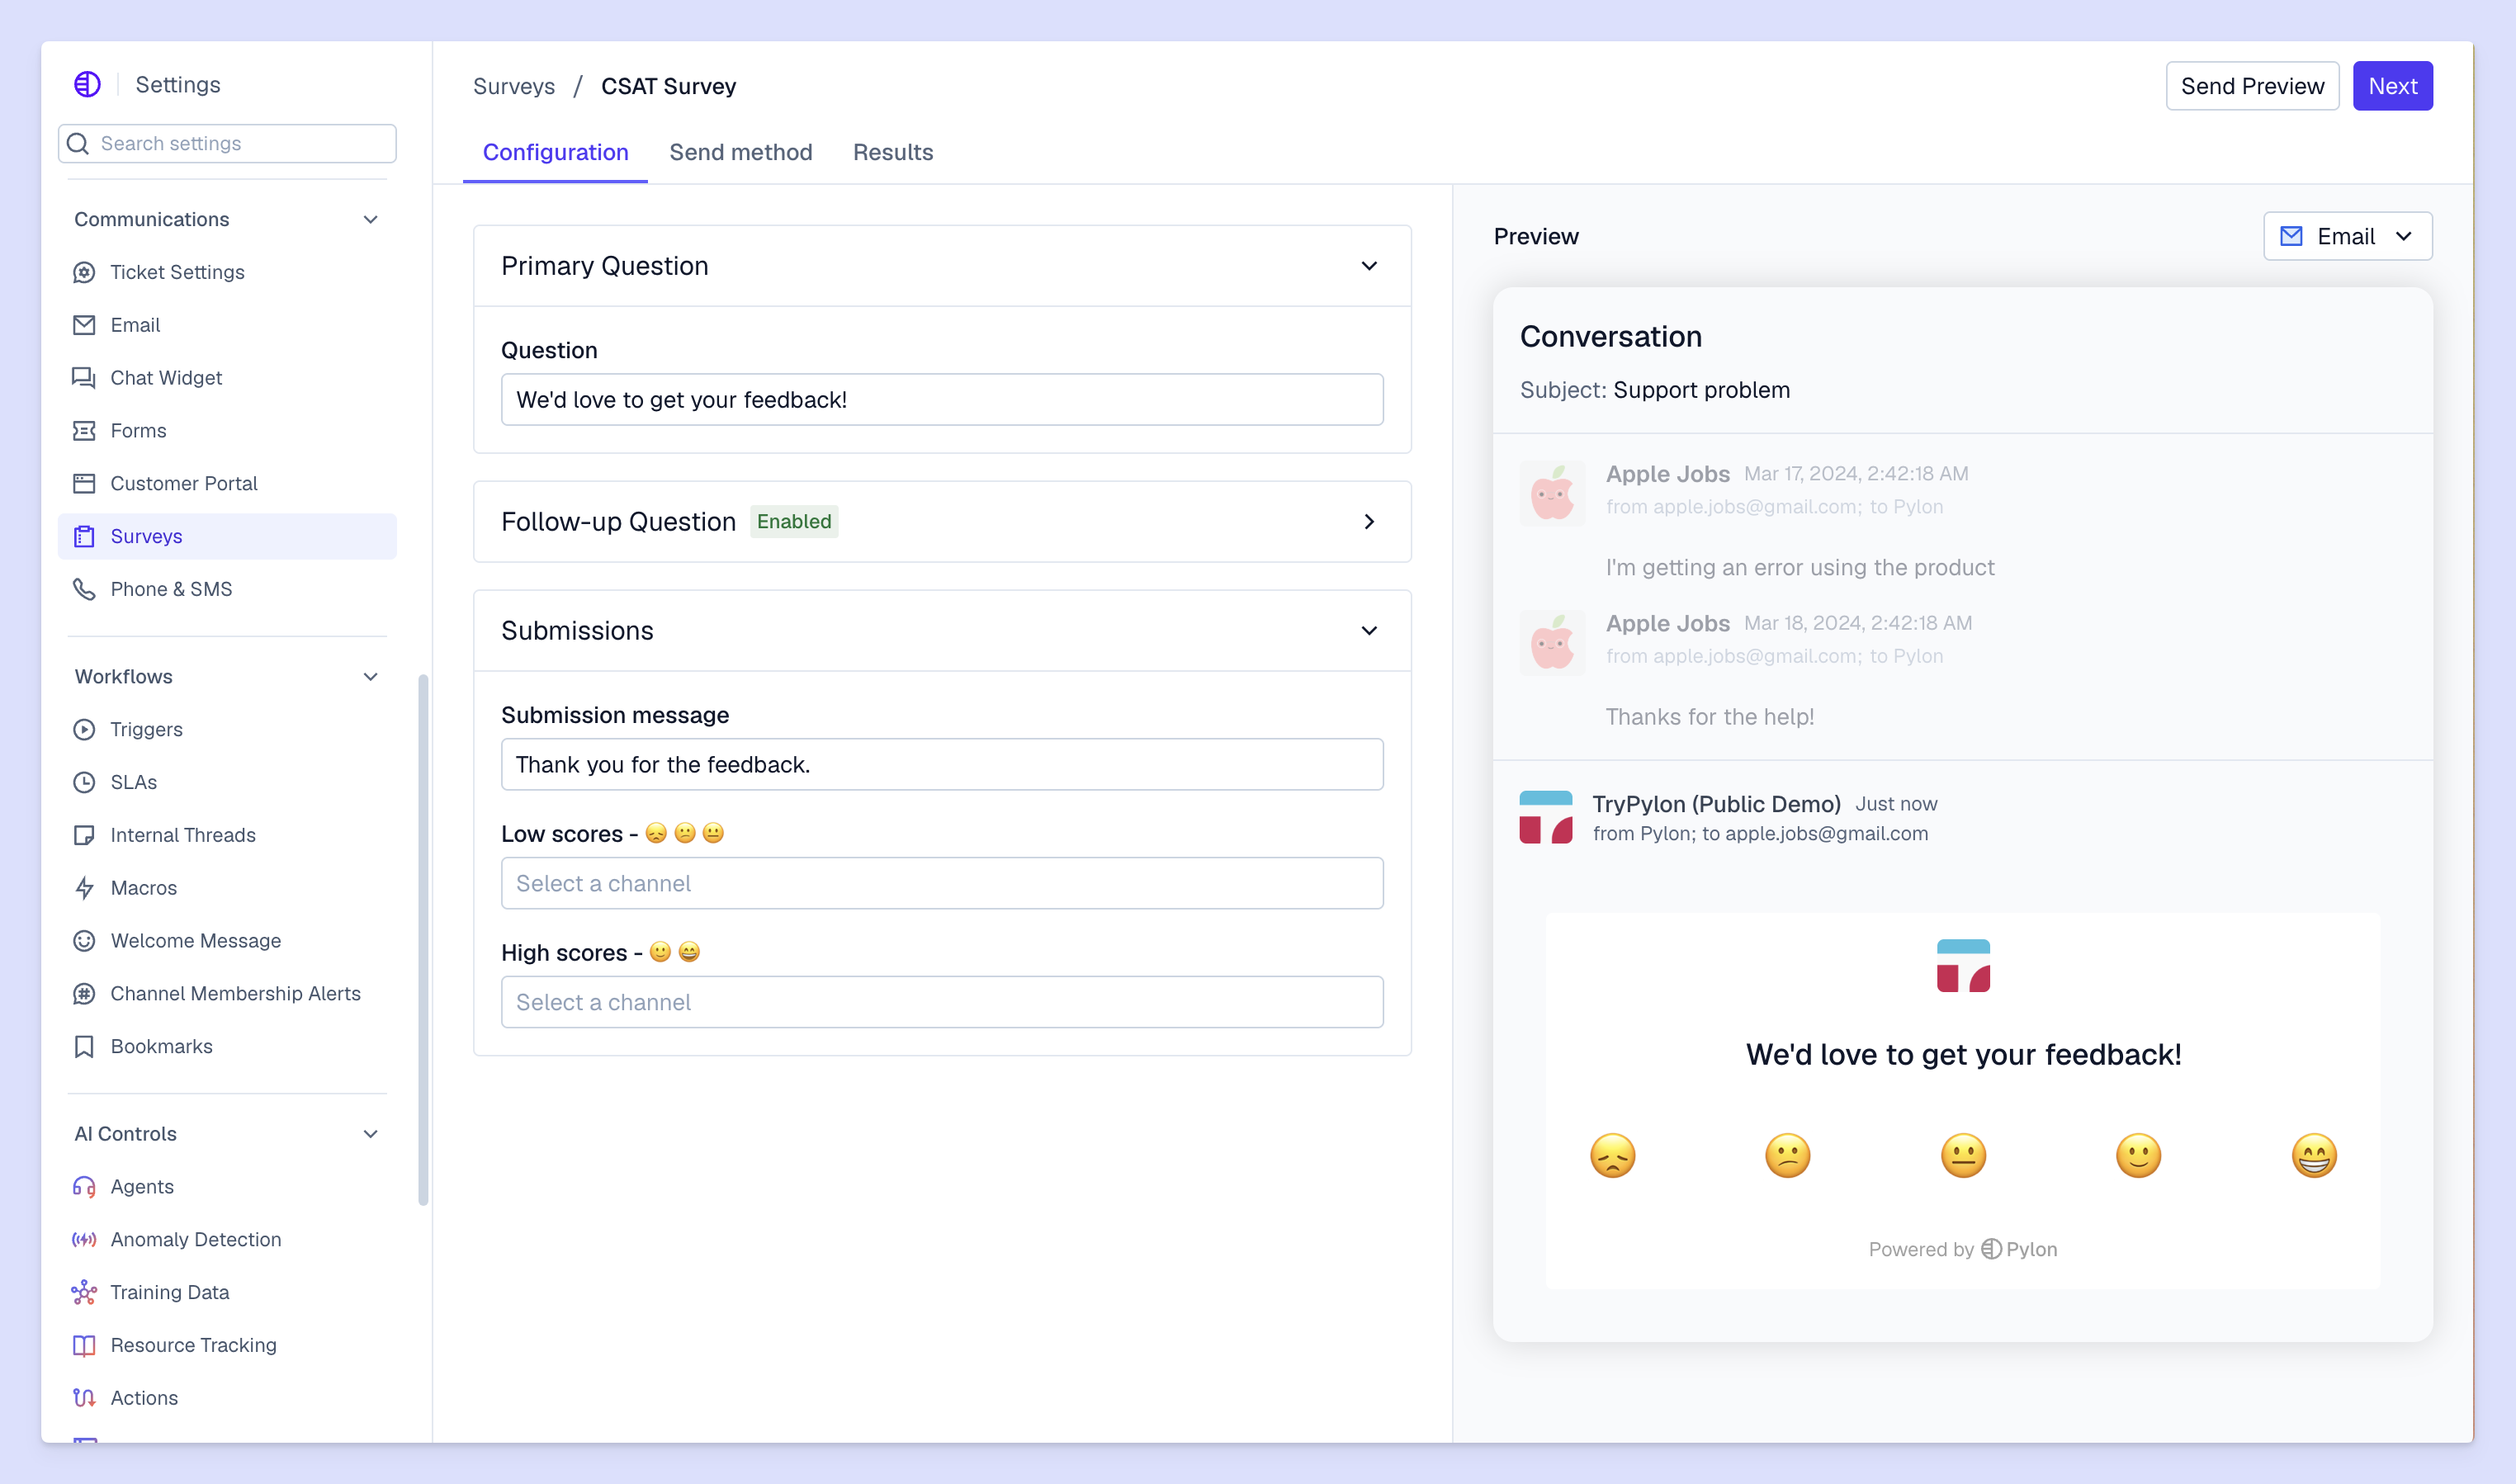
Pylon sends CSAT surveys on a 1–5 scale after an issue, with one survey per issue. NPS surveys use a 0–10 scale followed by a free-form response question. You can view results in Analytics and in each survey’s Results tab.