See our recent webinar → Introducing Agentic Support


Measuring key performance indicators (KPIs) helps you spot problems early. For service desks, KPIs are especially important: The right metrics reveal where system breakdowns affect your customers’ experience.
In this guide, we’ll look at the KPIs and metrics that matter most for B2B support teams. Then, see how you can track them to improve your company’s practices.
Metrics for service desk performance measure your support team’s success. They reveal what’s happening day-to-day and give you data like response times and ticket backlogs. Typically, they focus on large-scale support operations.
KPIs build on those metrics. They show your progress toward company goals so your team can focus on what actually makes an impact. They’re more tailored to company goals than metrics are.
For example, average response time is a metric. And the percentage of tickets that meet your first response time (FRT) goal is a KPI — it shows if your team is responding fast enough to meet your company’s service standards.
Together, metrics and KPIs help you gauge your support team’s speed, customer satisfaction rates, and workload. They reveal where processes need improvement and help you plan resources better.
Vanity metrics like number of responses sent are easy to track, but don’t actually reflect support quality. These four kinds of performance metrics and their associated KPIs show where you can make the biggest impact on customer experience.
Customer satisfaction metrics help you measure the support experience from your customers’ point of view. Common KPIs that use these metrics include your customer satisfaction score (CSAT) and net promoter score (NPS), both of which show how well you’re meeting expectations and general customer sentiment. Making changes based on this information helps your team reduce churn and improve retention.
Efficiency metrics show how well your team’s systems and tools work. When these systems fail, team members can’t do their jobs as well. Examples of related KPIs include FRT and ticket backlogs, which help you spot bottlenecks so your team can deliver faster, more consistent support.
Financial metrics help you understand the cost of running your service desk. ROI is an obvious financial metric, but financial KPIs work on a smaller scale (like cost per ticket) to see if your investment in specific tools and automations are paying off. This gives you data to secure your budget, justify headcount, and determine if you can scale sustainably.
Employee performance metrics look into things like average handle time and escalation rate to calculate your team members’ skills and productivity (individually, by team, and across the company). These metrics highlight where they need more training and help you build a confident team that’s ready to deliver great support.
Choose service desk KPIs that actually matter — you probably don’t need to collect data on everything. Instead, focus on the KPIs that align with your company’s priorities.
The following list includes a few common KPIs so you can identify what will impact your team and business outcomes the most.
Unclear metrics, inter-team communication gaps, and inconsistent workflows lead to unreliable data. Here’s how to measure and track your service desk KPIs accurately.
Before you start measuring, make sure your team uses the same KPI definitions. Document how each KPI is calculated, because small differences — like measuring FRT from ticket creation instead of assignment — can completely change the results. Clear definitions lead to more accurate data and align your team on what success actually looks like.
Use consistent categories, tags, and priority levels so your data is easy to compare across customers and time periods. Standardized workflows create cleaner datasets and reveal clearer patterns.
Automate data collection wherever you can. Human errors can slow teams down and make trend analysis difficult. Reliable tracking (like an AI assistant that monitors TTR) paired with verification means performance evaluations are backed by real data, not guesswork or rough estimates.
For example, you could track an IT support performance metric like FRT using an automation that timestamps every ticket when it comes in and when your team member sends the first response, then calculates the difference.
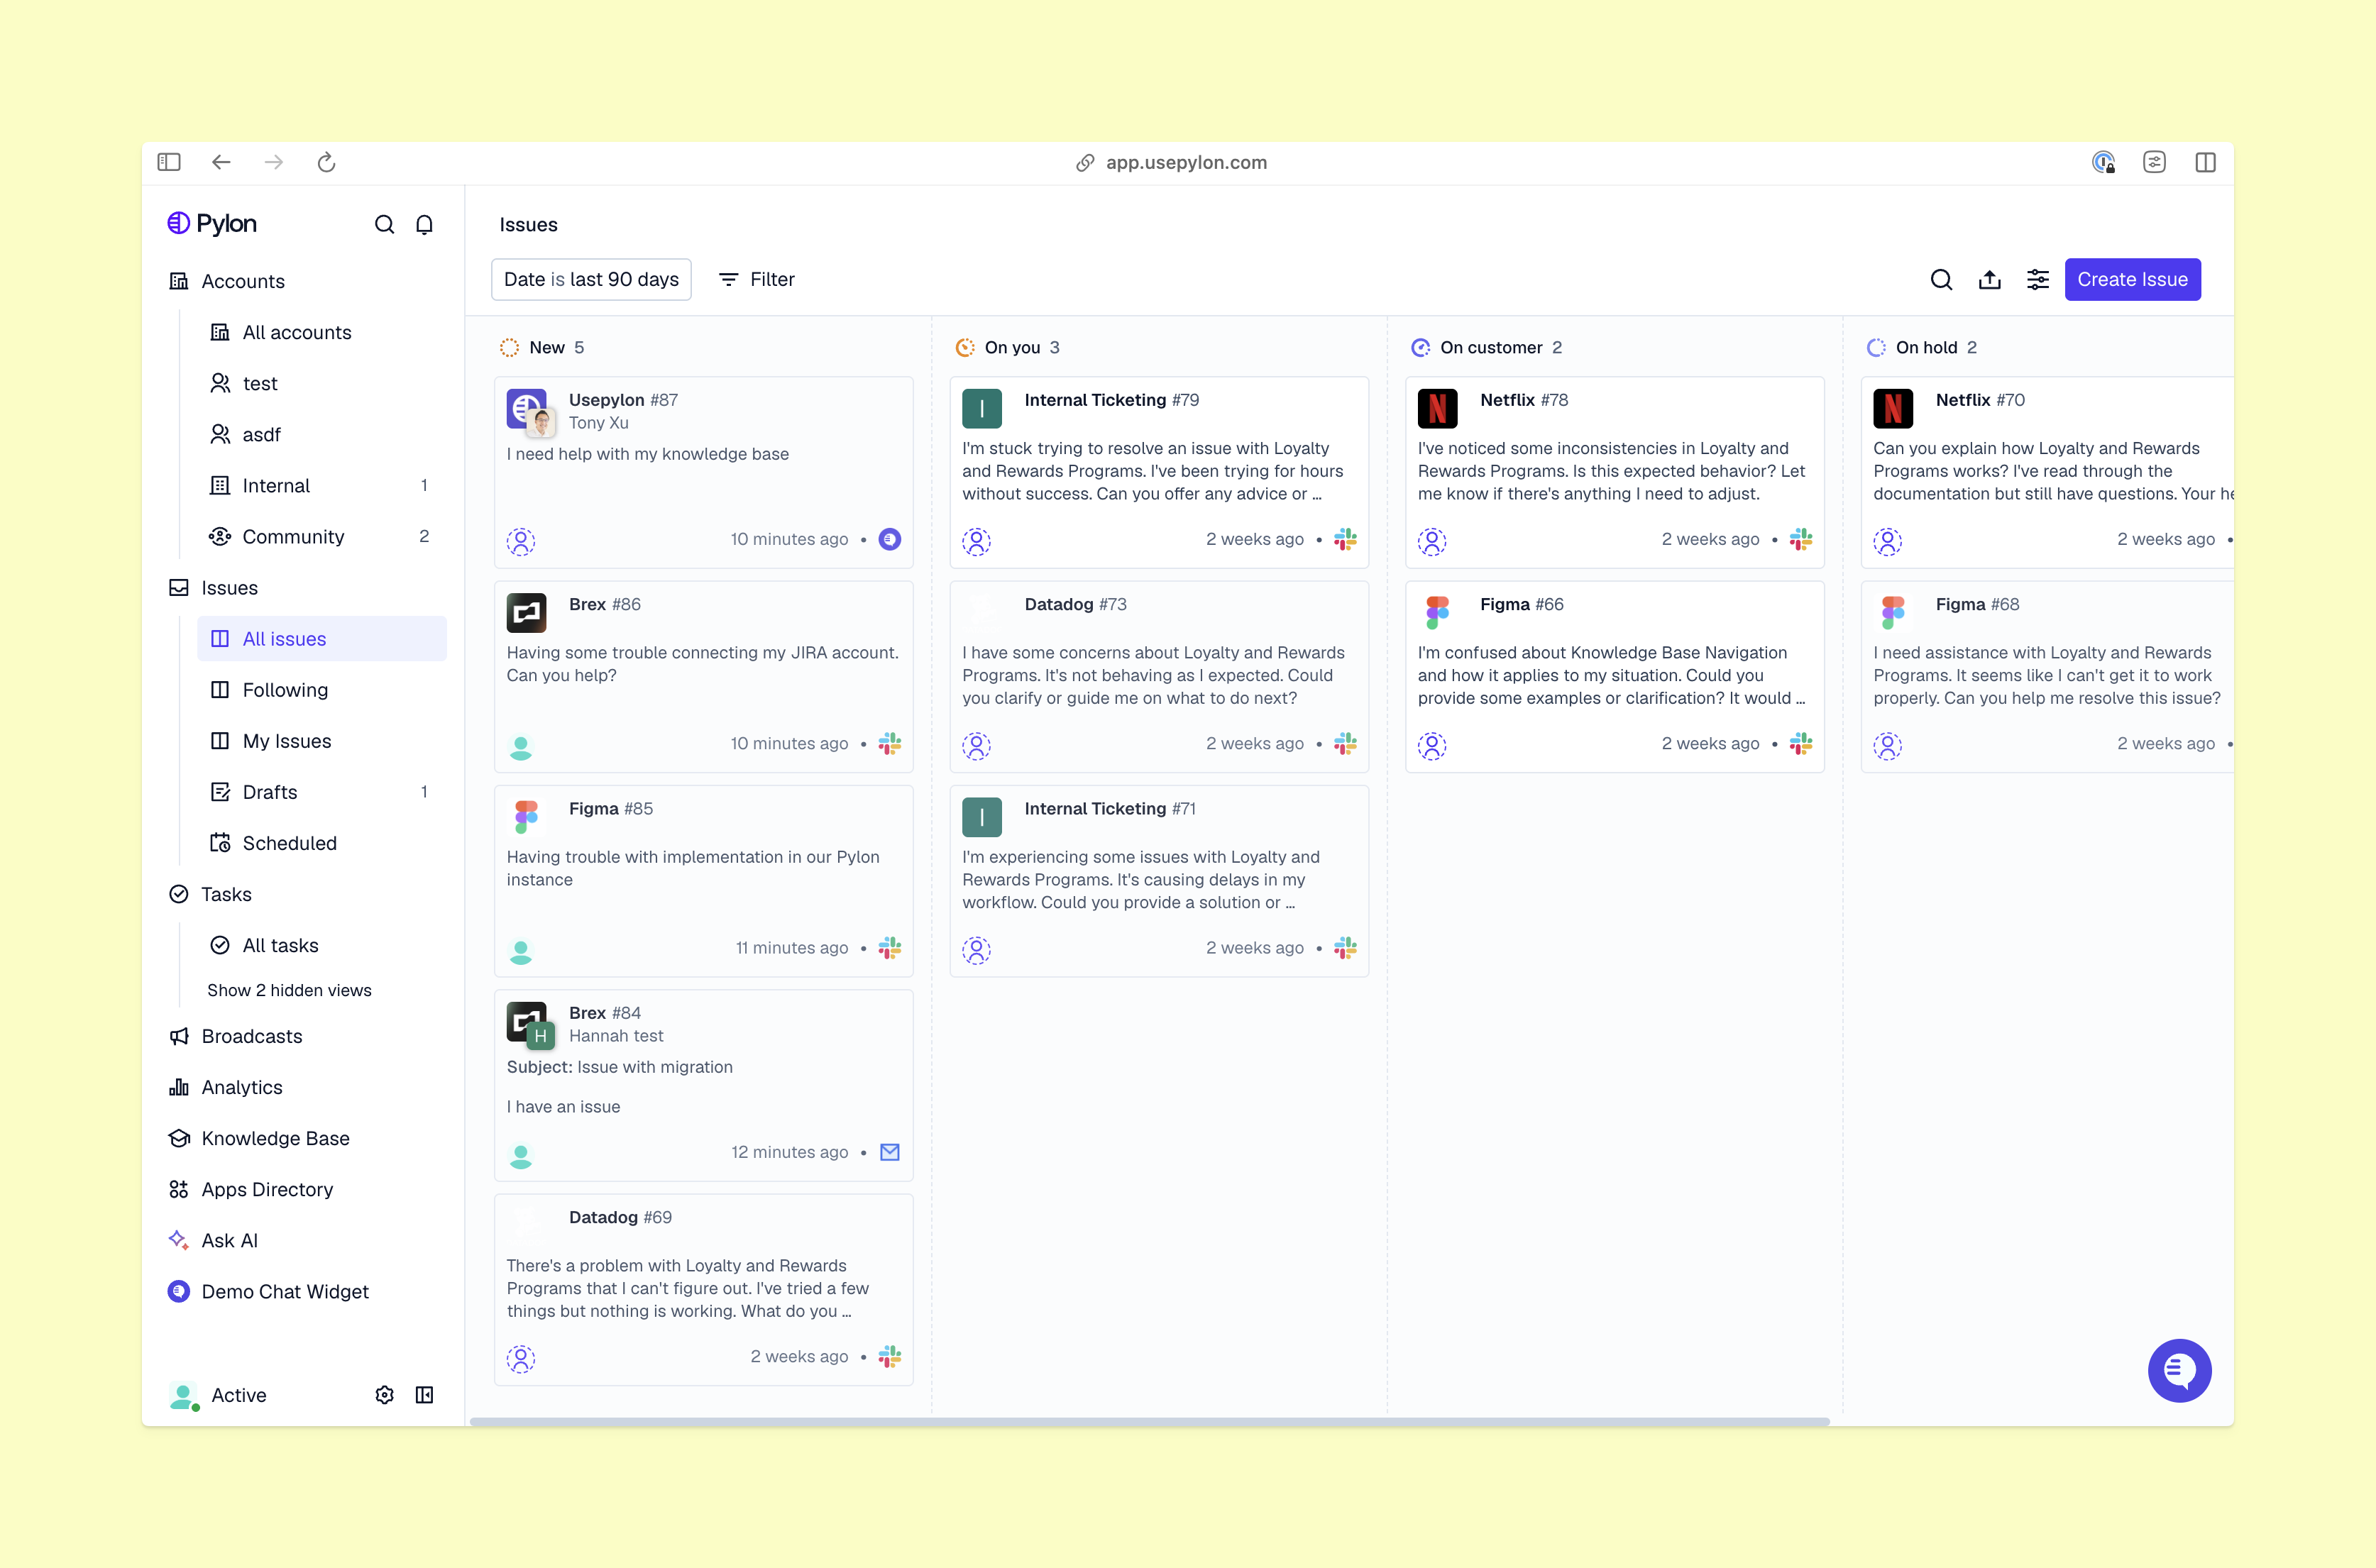
KPIs break down when conversations are scattered across channels. Moving every customer interaction onto one platform means things are less likely to get lost and lets you measure performance across the full support experience.
Dashboards and reports visualize performance metrics, so it’s easier for you to spot trends. Review them regularly to adjust recruitment efforts, improve workflows, and respond to shifts in customer demand. Continuous monitoring helps your team iterate quickly and improve support quality over time.
Here are some service desk best practices to create a better experience for everyone.
Your team sees gaps and opportunities in their work long before leadership does. Regular internal surveys can help you uncover:
A well-managed knowledge base — including step-by-step guides, troubleshooting instructions, and an FAQ — lets customers solve issues independently. This reduces ticket volume and frees your team to focus on more complicated tasks.
Chatbots and chat widgets help answer simple customer questions on their time, which reduces wait times and ticket backlog. They’re particularly useful for common questions, basic troubleshooting, and linking to relevant articles.
The fewer steps in your workflow, the more time your team has to focus on high-value customer interactions. Automation improves KPIs like FRT, TTR, and backlog. It also helps every channel stay consistent — AI can do things like respond to questions in your tone and voice, or auto-update customer data based on support conversations. For example, Pylon’s AI Assistants draft responses, tag issues, and generate knowledge content to help teams support the post-sales customer lifecycle.
The best-performing teams don’t track every metric and KPI — they focus on what actually ties to their goals. Automated platforms and software can help your team identify where you may be falling short and make regular improvements possible without increasing your workload.
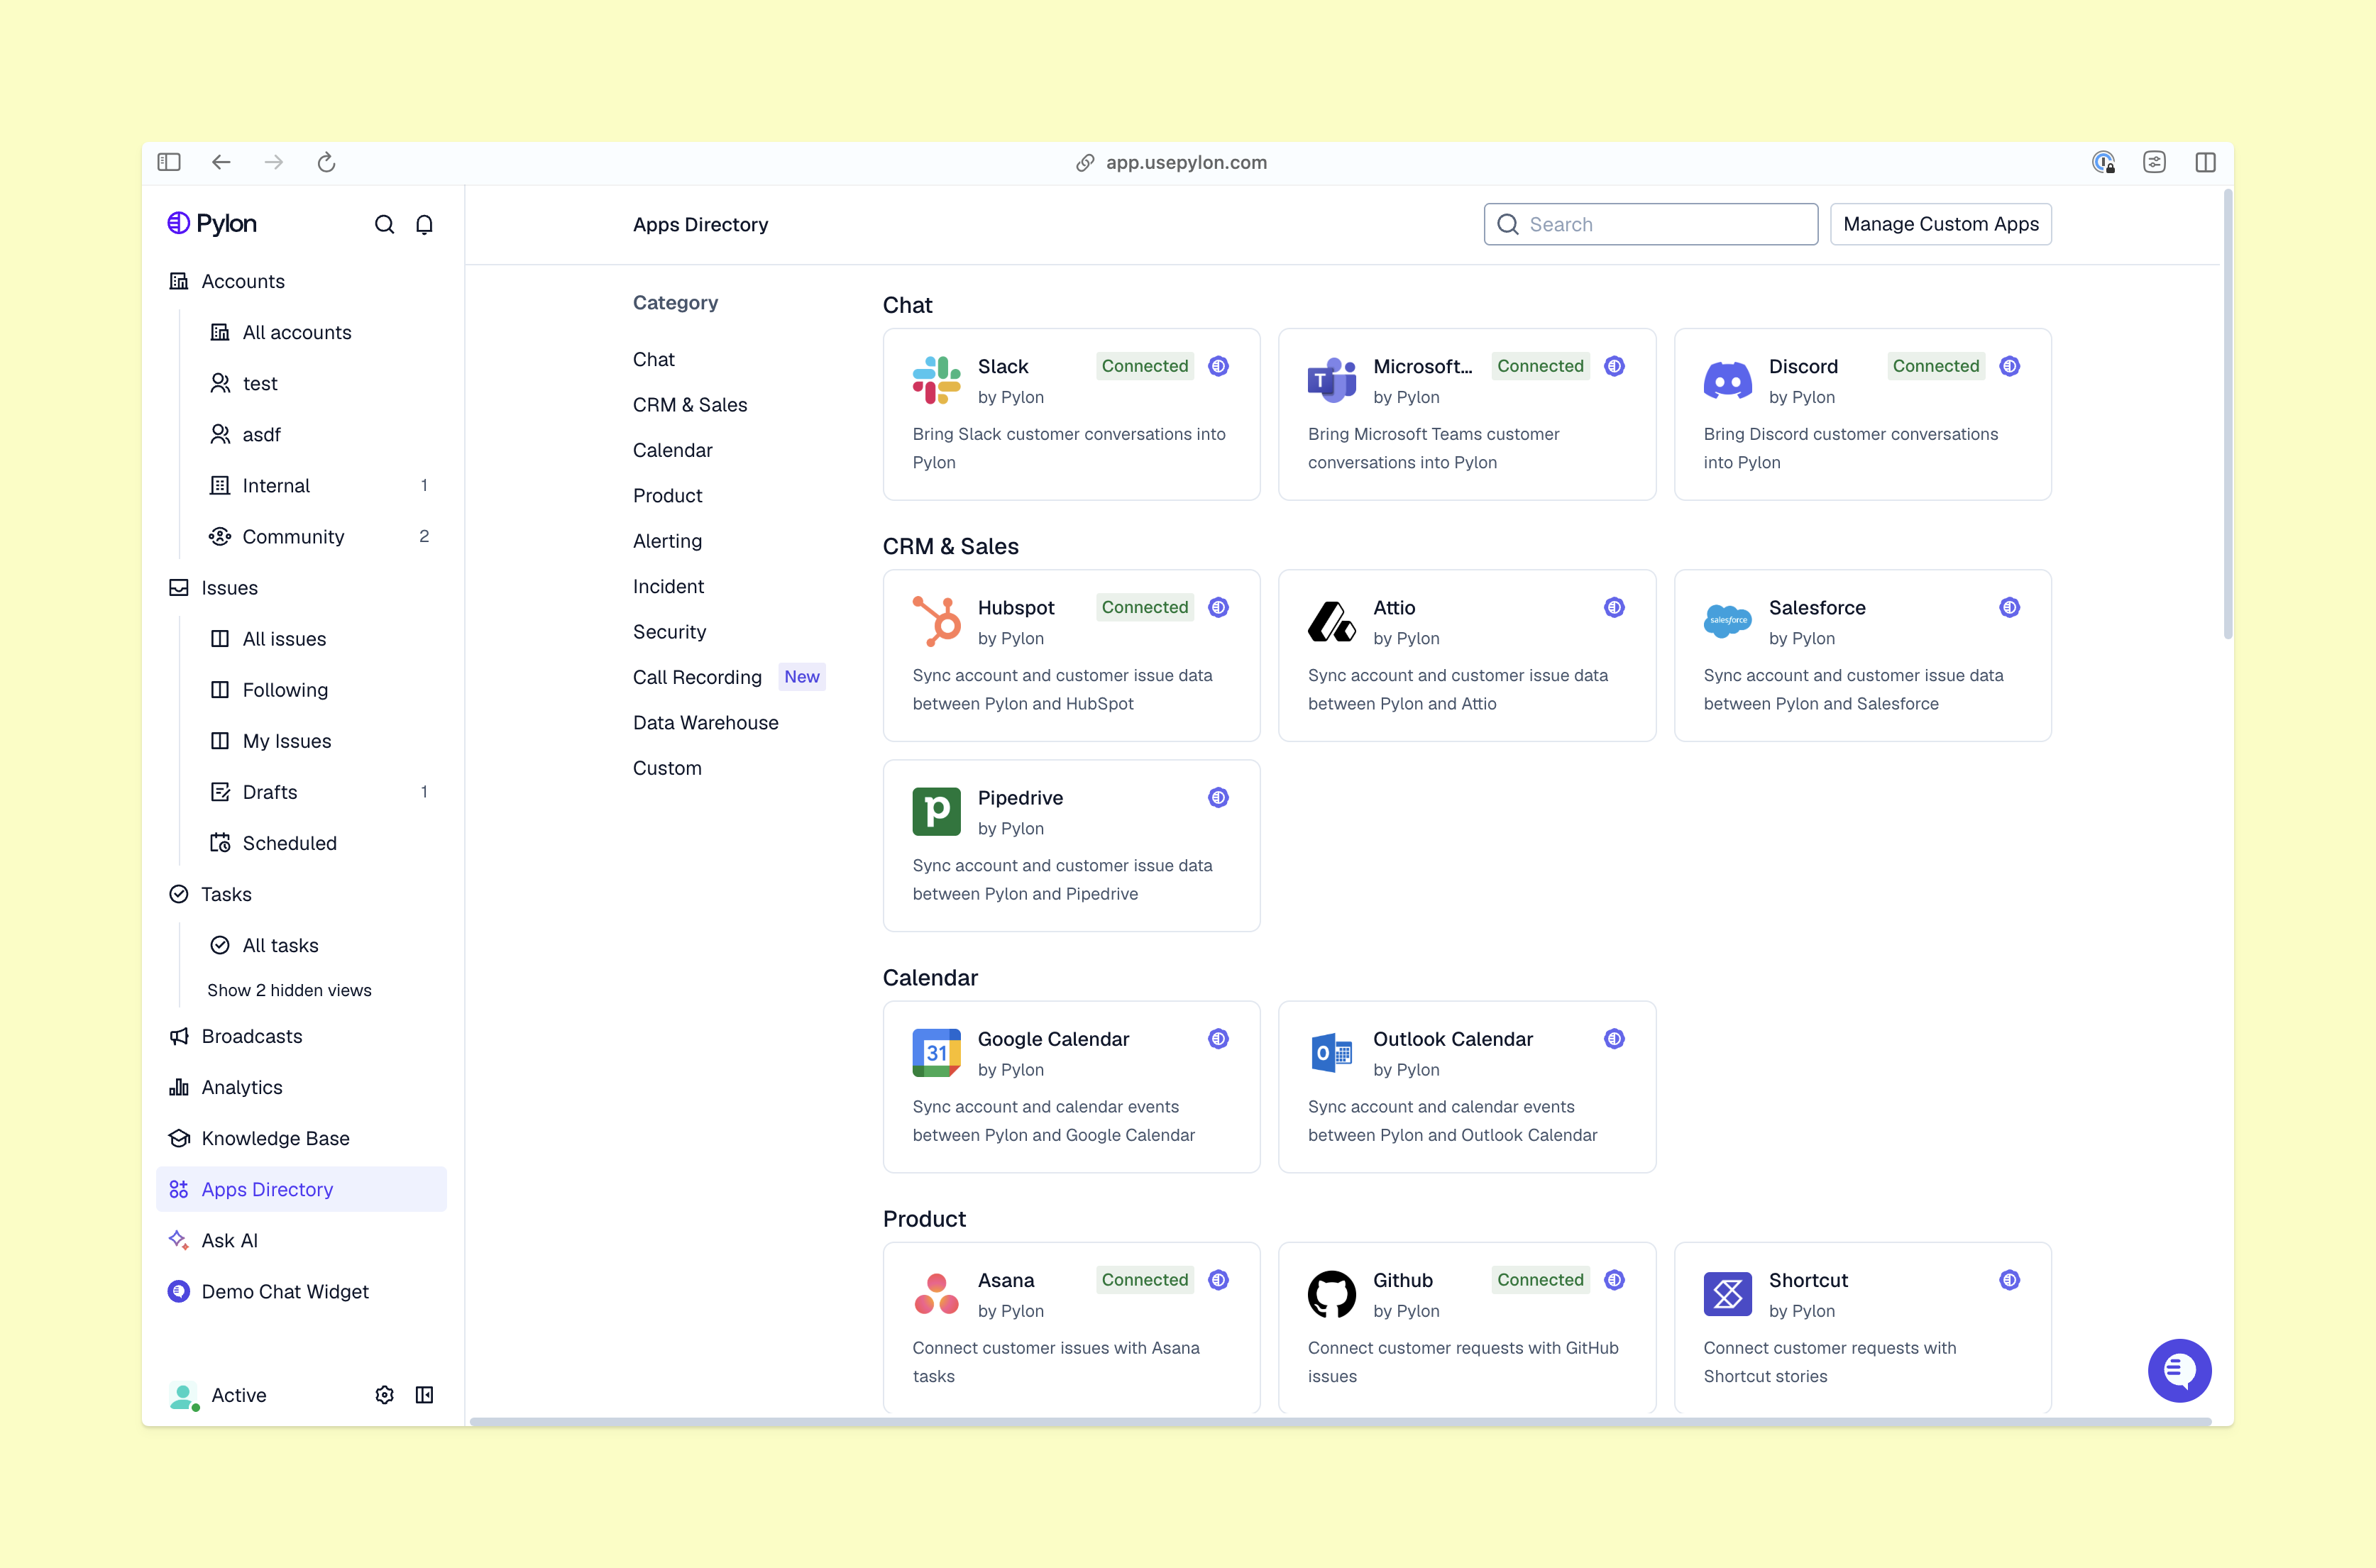
Pylon is the modern B2B support platform that offers true omnichannel support across Slack, Teams, email, chat, ticket forms, and more. Our AI Agents and Assistants automate busywork and reduce response times. Plus, with Account Intelligence that unifies scattered customer signals to calculate health scores and identify churn risk, we're built for customer success at scale.
Pylon Workforce Management is available now. See it in action with a live demo.